1.2 Module 14: Quantity Controls (Quotas)

WHAT YOU WILL LEARN
 The meaning of quantity controls, another way government intervenes in markets
 How quantity controls create problems and can make a market inefficient
 Who benefits and who loses from quantity controls, and why they are used despite their well-
known problems
Controlling Quantities
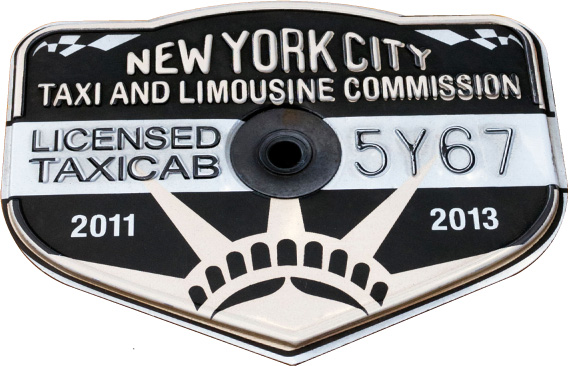
In the 1930s, New York City instituted a system of licensing for taxicabs: only taxis with a “medallion” were allowed to pick up passengers. Because this system was intended to ensure quality, medallion owners were supposed to maintain certain standards, including safety and cleanliness. A total of 11,787 medallions were issued, with taxi owners paying $10 for each medallion.
In 1995, there were still only 11,787 licensed taxicabs in New York, even though the city had meanwhile become the financial capital of the world, a place where hundreds of thousands of people in a hurry tried to hail a cab every day. That same year, an additional 400 medallions were issued, and after several rounds of sales of additional medallions, today there are 13,237 medallions.
The result of this restriction on the number of taxis was that a New York City taxi medallion became very valuable. In 2012, the price of a medallion was about $700,000! If you wanted to operate a taxi in New York, you had to lease a medallion from someone else or buy one for a going price.
It turns out that this story is not unique; other cities introduced similar medallion systems in the 1930s and, like New York, have issued few new medallions since. In San Francisco and Boston, as in New York, taxi medallions trade for six-
A quantity control, or quota, is an upper limit on the quantity of some good that can be bought or sold.
A license gives its owner the right to supply a good or service.
A taxi medallion system is a form of quantity control, or quota, by which the government regulates the quantity of a good that can be bought and sold rather than regulating the price. Typically, the government limits quantity in a market by issuing licenses; only people with a license can legally supply the good. A taxi medallion is just such a license. The government of New York City limits the number of taxi rides that can be sold by limiting the number of taxis to only those who hold medallions. There are many other cases of quantity controls, ranging from limits on how much foreign currency (for instance, British pounds or Mexican pesos) people are allowed to buy to the quantity of clams New Jersey fishing boats are allowed to catch.
Some attempts to control quantities are undertaken for good economic reasons, some for bad ones. In many cases, as we will see, quantity controls introduced to address a temporary problem become politically hard to remove later because the beneficiaries don’t want them abolished, even after the original reason for their existence is long gone. But whatever the reasons for such controls, they have certain predictable—
How Quantity Controls Work
To understand why a New York taxi medallion is worth so much money, we consider a simplified version of the market for taxi rides, shown in Figure 14-1. Just as we assumed in the analysis of rent control that all apartments were the same, we now suppose that all taxi rides are the same—
The New York medallion system limits the number of taxis, but each taxi driver can offer as many rides as he or she can manage. (Now you know why New York taxi drivers are so aggressive!) To simplify our analysis, however, we will assume that a medallion system limits the number of taxi rides that can legally be given to 8 million per year.
The demand price of a given quantity is the price at which consumers will demand that quantity.
Until now, we have derived the demand curve by answering questions of the form: “How many taxi rides will passengers want to take if the price is $5 per ride?” But it is possible to reverse the question and ask instead: “At what price will consumers want to buy 10 million rides per year?” The price at which consumers want to buy a given quantity—

The supply price of a given quantity is the price at which producers will supply that quantity.
Similarly, the supply curve represents the answer to questions of the form: “How many taxi rides would taxi drivers supply at a price of $5 each?” But we can also reverse this question to ask: “At what price will producers be willing to supply 10 million rides per year?” The price at which producers will supply a given quantity—
Now we are ready to analyze a quota. We have assumed that the city government limits the quantity of taxi rides to 8 million per year. Medallions, each of which carries the right to provide a certain number of taxi rides per year, are made available to selected people in such a way that a total of 8 million rides will be provided. Medallion holders may then either drive their own taxis or rent their medallions to others for a fee.
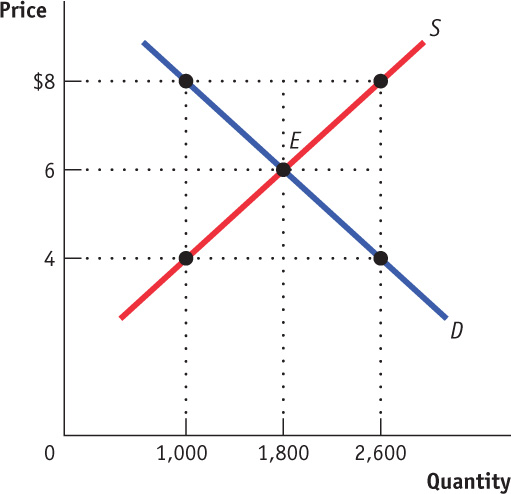
Figure 14-2 shows the resulting market for taxi rides, with the black vertical line at 8 million rides per year representing the quota. Because the quantity of rides is limited to 8 million, consumers must be at point A on the demand curve, corresponding to the shaded entry in the demand schedule: the demand price of 8 million rides is $6 per ride. Meanwhile, taxi drivers must be at point B on the supply curve, corresponding to the shaded entry in the supply schedule: the supply price of 8 million rides is $4 per ride.

But how can the price received by taxi drivers be $4 when the price paid by taxi riders is $6? The answer is that in addition to the market in taxi rides, there is also a market in medallions. Medallion-
To see how this all works, consider two imaginary New York taxi drivers, Sunil and Harriet. Sunil has a medallion but can’t use it because he’s recovering from a severely sprained wrist. So he’s looking to rent his medallion out to someone else. Harriet doesn’t have a medallion but would like to rent one. Furthermore, at any point in time there are many other people like Harriet who would like to rent a medallion. Suppose Sunil agrees to rent his medallion to Harriet. To make things simple, assume that any driver can give only one ride per day and that Sunil is renting his medallion to Harriet for one day. What rental price will they agree on?
To answer this question, we need to look at the transactions from the viewpoints of both drivers. Once she has the medallion, Harriet knows she can make $6 per day—
A quantity control, or quota, drives a wedge between the demand price and the supply price of a good; that is, the price paid by buyers ends up being higher than that received by sellers. The difference between the demand and supply price at the quota amount is the quota rent, the earnings that accrue to the license-
It is no coincidence that $2 is exactly the difference between $6, the demand price of 8 million rides, and $4, the supply price of 8 million rides. In every case in which the supply of a good is legally restricted, there is a wedge between the demand price of the quantity transacted and the supply price of the quantity transacted. This wedge, illustrated by the double-
So Figure 14-2 also illustrates the quota rent in the market for New York taxi rides. The quota limits the quantity of rides to 8 million per year, a quantity at which the demand price of $6 exceeds the supply price of $4. The wedge between these two prices, $2, is the quota rent that results from the restrictions placed on the quantity of taxi rides in this market.
But wait a second. What if Sunil doesn’t rent out his medallion? What if he uses it himself? Doesn’t this mean that he gets a price of $6? No, not really. Even if Sunil doesn’t rent out his medallion, he could have rented it out, which means that the medallion has an opportunity cost of $2: if Sunil decides to use his own medallion and drive his own taxi rather than renting his medallion to Harriet, the $2 represents his opportunity cost of not renting out his medallion. That is, the $2 quota rent is now the rental income he forgoes by driving his own taxi.
In effect, Sunil is in two businesses—
Notice, by the way, that quotas—
The Costs of Quantity Controls
Like price controls, quantity controls can have some predictable and undesirable side effects. The first is the by-
The same is true for the next 1 million rides: New Yorkers would be willing to pay at least $5 per ride when the quantity of rides is increased from 9 to 10 million, and taxi drivers would be willing to provide those rides as long as they got at least $5 per ride. Again, these rides would have occurred without the quota.
Only when the market has reached the unregulated market equilibrium quantity of 10 million rides are there no “missed-
Deadweight loss is the lost gains associated with transactions that do not occur due to market intervention.
Economists have a special term for the lost gains from missed opportunities such as these: deadweight loss. Generally, when the demand price exceeds the supply price, there is a deadweight loss. Figure 14-2 illustrates the deadweight loss with a shaded triangle between the demand and supply curves. This triangle represents the missed gains from taxi rides prevented by the quota, a loss that is experienced by both disappointed would-
Because there are transactions that people would like to make but are not allowed to, quantity controls generate an incentive to evade them or even to break the law. New York’s taxi industry again provides clear examples. Taxi regulation applies only to those drivers who are hailed by passengers on the street. A car service that makes prearranged pickups does not need a medallion. As a result, such hired cars provide much of the service that might otherwise be provided by taxis, as in other cities. In addition, there are substantial numbers of unlicensed cabs that simply defy the law by picking up passengers without a medallion. Because these cabs are illegal, their drivers are unregulated, and they generate a disproportionately large share of traffic accidents in New York City.
THE CLAMS OF THE JERSEY SHORE

One industry that New Jersey really dominates is clam fishing. The Garden State typically supplies about 70% of the country’s surf clams, whose tongues are used in fried-
In the 1980s, however, excessive fishing threatened to wipe out New Jersey’s clam beds. To save the resource, the U.S. government introduced a clam quota, which sets an overall limit on the number of bushels of clams that may be caught and allocates licenses to owners of fishing boats based on their historical catches.
Notice, by the way, that this is an example of a quota that is probably justified by broader economic and environmental considerations—
Once the quota system was established, many boat owners stopped fishing for clams. They realized that rather than operate a boat part time, it was more profitable to sell or rent their licenses to someone else, who could then assemble enough licenses to operate a boat full time. Today, there are about 50 New Jersey boats fishing for clams; the license required to operate one is worth more than the boat itself.
Module 14 Review
Solutions appear at the back of the book.
Check Your Understanding
1. Suppose that the supply and demand for taxi rides is given by Figure 14-1 and a quota is set at 6 million rides. Replicate the graph from Figure 14-1, and identify each of the following on your graph:
-
a. the price of a ride
-
b. the quota rent
-
c. the deadweight loss resulting from the quota
Suppose the quota on taxi rides is increased to 9 million. -
d. What happens to the quota rent and the deadweight loss?
2. Again replicate the graph from Figure 14-1. Suppose that the quota is 8 million rides and that demand decreases due to a decline in tourism. Show on your graph the smallest parallel leftward shift in demand that would result in the quota no longer having an effect on the market.
Multiple-
Refer to the graph provided to answer questions 1–
Question
NilD5c7cXyAAYmmm6MCVhV2GVZMMj02DOgtw8HzwXPl34/nRPIIj/gRrY8FLR8vG6Vv/VhxnLygFHVOe1gjIKHqoxm3LlDc25G5WG/Dif4OcXwv2/FVPKy4VocdFSWTCe5NDJIrc89327C/OeKaFRlkHOkPA5jNIYCKbGaXcWm3gWVHUxaxroPHa+TbhUD9HLstxXBZtBYqb43uUKuzlLllumFuCkn18py+qAu6YyIFOwJryUsoUAPrmkQZvzkevh0d7Uuaul7gjLDmEbdVi0LhEbSj6NMRndxmERg==Question
zWCMaVFt+wjvDb7iCgTSD4YOXvn0qUaCbIh86d/MqIDct+ywaIoUUz+MhbD3Rclyqyq9CqQnjz4iO+4q6NtOtye0Oy3vDLyjtNW1FJVpa5odMP5Tg8OWA4XT7Cd47LsEhJpDY2jzUA4nGfuAfGAtjK12mgnFmtWmZ40Gc3tC2vj5rH3uVSk+XAzBaN6bqHxu5fvRsv0bU/NzgIGSNZhOqhmDeWRnqjmzYq8jGWlMg09Idars11Zv+yzl6gAZVKn+8jN6maWf+ZYv+tk6MyjBY+fHKMc6U/1va3OViA==Question
NOJtIqKIv+ZFleNXwbG+c6XDmIh17X4JMY1KOv9AYlcaF06DNMcIAxpSQZZM9SpVw/602MDGtZzJ1gB2BMdRUfOMYKEHPZz+XRBoDDyNKupXkDsWS8EY7vMkTX2EZh/Pg9e3dKur6CqNcj435yJZ4+0iPByyEx+Ulom/Tbru0FDXpiZiuw5MoUN3+yZgx+ZPtnuoZVLrdnqnSdlDN+rsRO2m8HXL+JjBLWO82NsWUA1p6ZxNx4z7QlhetUUECAdja4C63QhBYkGfuD35j1XPTA==Question
pKlCBGiTIXpCddyQFjCLrxPQ65GsMGTHw7mY4tOVgBuzsfYoHpCIJ0ETF/+LsgjhTkfYIrQomkkuwYqAbEOtoaYzi3NR4Te13/Zc5grc25QoMs5CRLupwLxwYcMM1x4i0KaN4HzYuVmSngm13dF/QEcLre2FRN2PFE6sUlLOBW9U3OpqW3vrI4UHj9NoClwb2BTkXXvN2K9BU8N0FgEBMte9EY9qWqS1/T8/Y7dZcO+n1JdIQELTPaQ45v4wzgtifLlJCzhQFksehg6PRxeNR83X+HjvH0toH7nf4lo45cJJEidKn3p1Xkj/oCEgxsEMCg5TpzUBRPYvzayQ0Aw4OcSbxEydRBEf93eegSif2QuWvip9FoJ9jptb5iI8IdYo/fSShB41MunFHAgnmKOkvElVzI5doYKFZEuvm/KT3KqJiyFm7agbwo1SAT3Cymh6NumGGMTgSQsOE90RlRjfOQl55m8Vkf9teKe+WzovnFycjmDwnqAIKhwFfPcy7d0PsjOEzEjtLb8PsowCRZyiWZUUmYOPDLQrKXB0TSQNK67HB2mKLYBdcol5bwoH72ZfxmTtvkwQP24e45iobEVKyfhJmJpJVVkFNAfkohi9QpP7UOvln7YQ+SKC0yk=Question
AOdTYuakL3rQ7tQdiHn1MDbekoVmiUvT94NWVxmCG6TesHAmoyiRVkrq68mgwvJhIoIZAlXKjtkp0aGktUYNq7+V49fp94UF3LquZt78jK6M3T/pP3qggXF780/TLnjSgrWNVaPYeH2EgBp2wZqVSkaPM3LfLhPa0kaJ6g0ZAaWj0odwIaBbiM4AqEZNdMmsLGhFbcr9p60k+5Nfr2dVI0s6xBxh1kMOcKQH0Ri02q0lLa8o/g2hflydOgB62jodSEhrMJgKpkM4IJoyI8NCPmgh8O5d9r9r3nvZVi/fp1mZAdC54Npd1rT7O1lXDU/0buApMeVRL7IkYPHriZsIrjlbWhVYFfd1qv8QkduLKfz6jCyr07lAm7BP1XY=Critical-
Draw a correctly labeled graph of the market for taxicab rides. On the graph, draw and label a vertical line showing the level of an effective quota. Label the demand price, the supply price, and the quota rent.