Utility and Consumption
An individual’s consumption bundle is the collection of all the goods and services consumed by that individual.
An individual’s utility function gives the total utility generated by his or her consumption bundle.
An individual’s utility depends on everything that individual consumes, from apples to Ziploc bags. The set of all the goods and services an individual consumes is known as the individual’s consumption bundle. The relationship between an individual’s consumption bundle and the total amount of utility it generates for that individual is known as the utility function. The utility function is a personal matter; two people with different tastes will have different utility functions. Someone who actually likes to consume 40 fried clams in a sitting must have a utility function that looks different from that of someone who would rather stop at 5 clams.
So we can think of consumers as using consumption to “produce” utility, much in the same way as in later chapters we will think of producers as using inputs to produce output. However, it’s obvious that people do not have a little computer in their heads that calculates the utility generated by their consumption choices. Nonetheless, people must make choices, and they usually base them on at least a rough attempt to decide which choice will give them greater satisfaction. I can have either soup or salad with my dinner. Which will I enjoy more? I can go to Disney World this year or save the money toward buying a new car. Which will make me happier?
The concept of a utility function is just a way of representing the fact that when people consume, they take into account their preferences and tastes in a more or less rational way.
A util is a unit of utility.
How do we measure utility? For the sake of simplicity, it is useful to suppose that we can measure utility in hypothetical units called—
Figure 10-1 illustrates a utility function. It shows the total utility that Cassie, who likes fried clams, gets from an all-
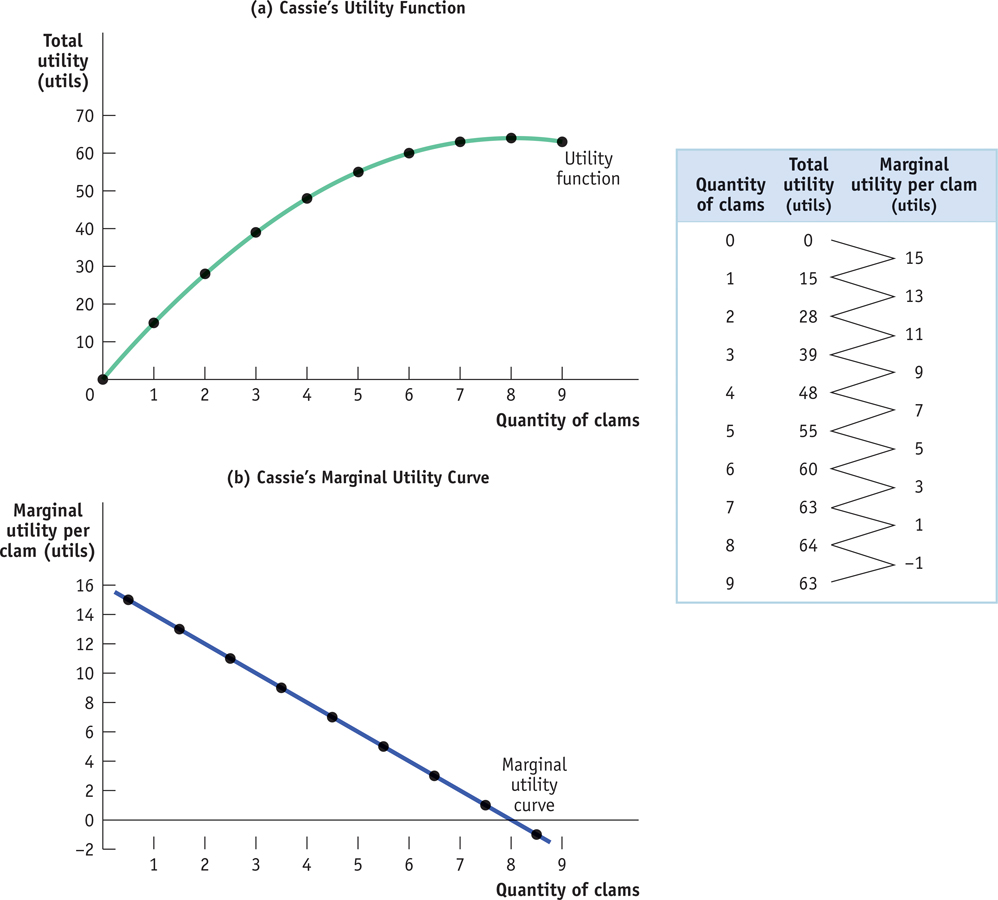
Cassie’s utility function slopes upward over most of the range shown, but it gets flatter as the number of clams consumed increases. And in this example it eventually turns downward. According to the information in the table in Figure 10-1, nine clams is a clam too many. Adding that additional clam actually makes Cassie worse off: it would lower her total utility. If she’s rational, of course, Cassie will realize that and not consume the ninth clam.
So when Cassie chooses how many clams to consume, she will make this decision by considering the change in her total utility from consuming one more clam. This illustrates the general point: to maximize total utility, consumers must focus on marginal utility.