The Short-Run Industry Supply Curve
Recall that in the short run the number of producers in an industry is fixed—there is no entry or exit. And you may also remember from Chapter 3 that the market supply curve is the horizontal sum of the individual supply curves of all producers—you find it by summing the total output across all suppliers at every given price. We will do that exercise here under the assumption that all the producers are alike—an assumption that makes the derivation particularly simple. So let’s assume that there are 100 Christmas tree farms, each with the same costs as Noelle’s farm.
The short-run industry supply curve shows how the quantity supplied by an industry depends on the market price given a fixed number of producers.
Each of these 100 farms will have an individual short-run supply curve like the one in Figure 12-4. At a price below $10, no farms will produce. At a price of $10 or more, each farm will produce the quantity of output at which its marginal cost is equal to the market price. As you can see from Figure 12-4, this will lead each farm to produce 40 trees if the price is $14 per tree, 50 trees if the price is $18, and so on. So if there are 100 tree farms and the price of Christmas trees is $18 per tree, the industry as a whole will produce 5,000 trees, corresponding to 100 farms × 50 trees per farm, and so on. The result is the short-run industry supply curve, shown as S in Figure 12-5. This curve shows the quantity that producers will supply at each price, taking the number of producers as given.
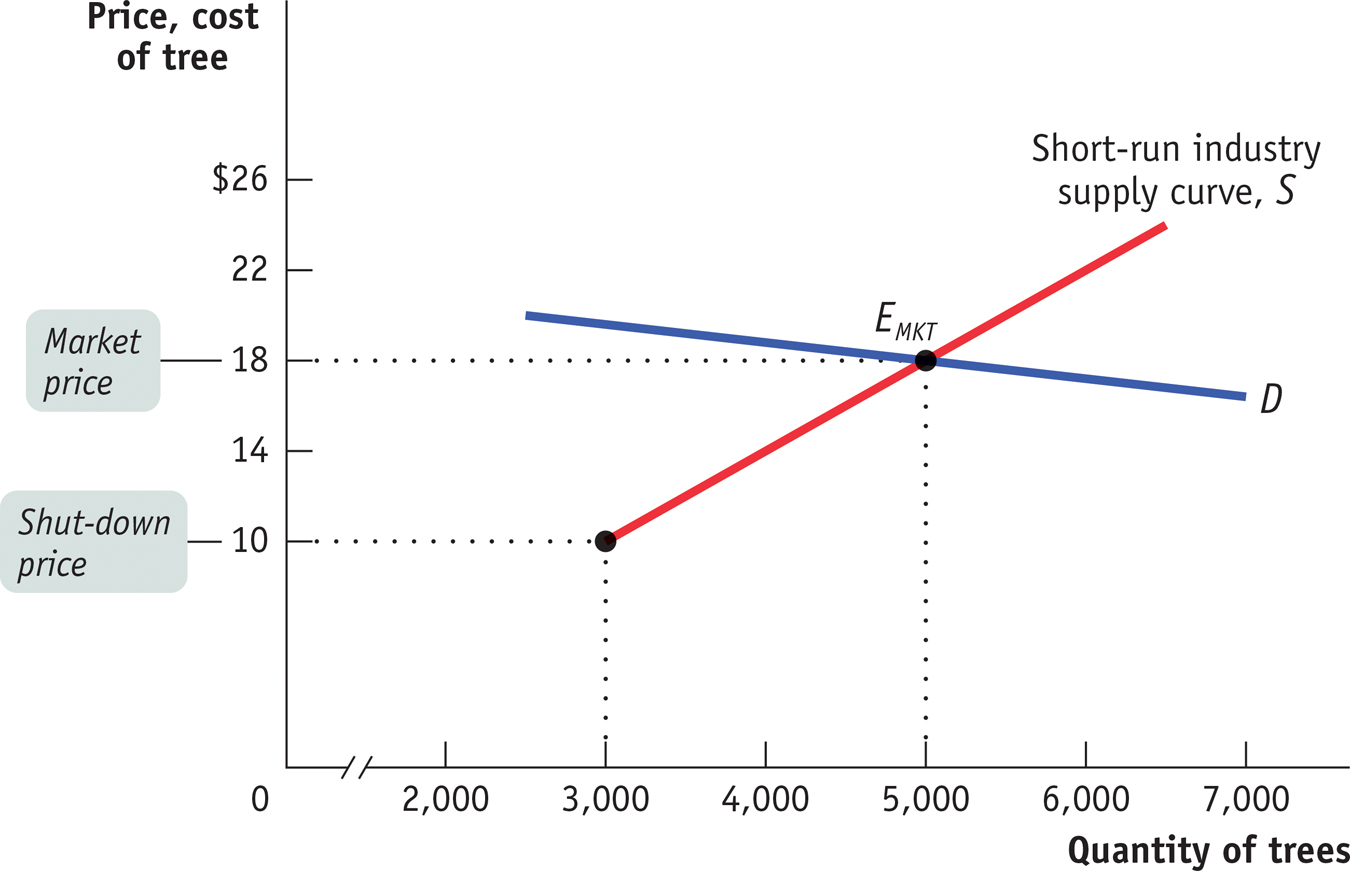
The Short-Run Market Equilibrium The short-run industry supply curve, S, is the industry supply curve taking the number of producers—here, 100—as given. It is generated by adding together the individual supply curves of the 100 producers. Below the shut-down price of $10, no producer wants to produce in the short run. Above $10, the short-run industry supply curve slopes upward, as each producer increases output as price increases. It intersects the demand curve, D, at point EMKT, the point of short-run market equilibrium, corresponding to a market price of $18 and a quantity of 5,000 trees.
There is a short-run market equilibrium when the quantity supplied equals the quantity demanded, taking the number of producers as given.
The demand curve D in Figure 12-5 crosses the short-run industry supply curve at EMKT, corresponding to a price of $18 and a quantity of 5,000 trees. Point EMKT is a short-run market equilibrium: the quantity supplied equals the quantity demanded, taking the number of producers as given. But the long run may look quite different, because in the long run farms may enter or exit the industry.