The Monopolist’s Profit-Maximizing Output and Price

PITFALLS: FINDING THE MONOPOLY PRICE

PITFALLS

FINDING THE MONOPOLY PRICE
In order to find the profit-maximizing quantity of output for a monopolist, you look for the point where the marginal revenue curve crosses the marginal cost curve. Point A in Figure 13-6 is an example.
However, it’s important not to fall into a common error: imagining that point A also shows the price at which the monopolist sells its output. It doesn’t: it shows the marginal revenue received by the monopolist, which we know is less than the price.
To find the monopoly price, you have to go up vertically from A to the demand curve. There you find the price at which consumers demand the profit-maximizing quantity. So the profit-maximizing price-quantity combination is always a point on the demand curve, like B in Figure 13-6.

To complete the story of how a monopolist maximizes profit, we now bring in the monopolist’s marginal cost. Let’s assume that there is no fixed cost of production; we’ll also assume that the marginal cost of producing an additional diamond is constant at $200, no matter how many diamonds De Beers produces. Then marginal cost will always equal average total cost, and the marginal cost curve (and the average total cost curve) is a horizontal line at $200, as shown in Figure 13-6.

To maximize profit, the monopolist compares marginal cost with marginal revenue. If marginal revenue exceeds marginal cost, De Beers increases profit by producing more; if marginal revenue is less than marginal cost, De Beers increases profit by producing less. So the monopolist maximizes its profit by using the optimal output rule:

The Monopolist’s Profit-Maximizing Output and Price This figure shows the demand, marginal revenue, and marginal cost curves. Marginal cost per diamond is constant at $200, so the marginal cost curve is horizontal at $200. According to the optimal output rule, the profit-maximizing quantity of output for the monopolist is at MR = MC, shown by point A, where the marginal cost and marginal revenue curves cross at an output of 8 diamonds. The price De Beers can charge per diamond is found by going to the point on the demand curve directly above point A, which is point B here—a price of $600 per diamond. It makes a profit of $400 × 8 = $3,200. A perfectly competitive industry produces the output level at which P = MC, given by point C, where the demand curve and marginal cost curves cross. So a competitive industry produces 16 diamonds, sells at a price of $200, and makes zero profit.

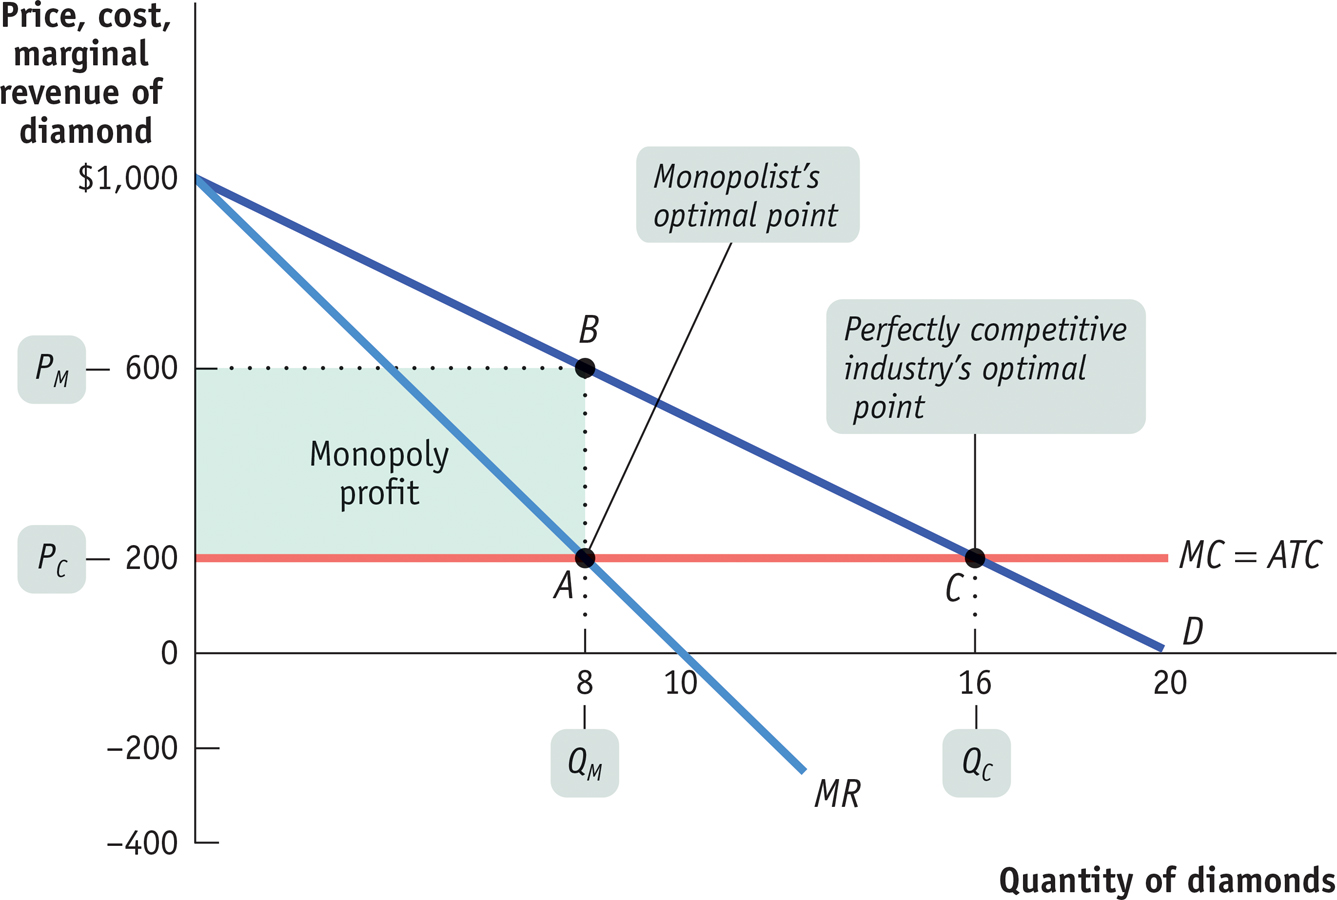
The monopolist’s optimal point is shown in Figure 13-6. At A, the marginal cost curve, MC, crosses the marginal revenue curve, MR. The corresponding output level, 8 diamonds, is the monopolist’s profit-maximizing quantity of output, QM. The price at which consumers demand 8 diamonds is $600, so the monopolist’s price, PM, is $600—corresponding to point B. The average total cost of producing each diamond is $200, so the monopolist earns a profit of $600 – $200 = $400 per diamond, and total profit is 8 × $400 = $3,200, as indicated by the shaded area.