The Socially Optimal Quantity of Pollution
How much pollution should society allow? We learned in Chapter 9 that “how much” decisions always involve comparing the marginal benefit from an additional unit of something with the marginal cost of that additional unit. The same is true of pollution.
The marginal social cost of pollution is the additional cost imposed on society as a whole by an additional unit of pollution.
The marginal social cost of pollution is the additional cost imposed on society as a whole by an additional unit of pollution.
For example, sulfur dioxide from coal-
The marginal social benefit of pollution is the additional gain to society as a whole from an additional unit of pollution.
The marginal social benefit of pollution is the benefit to society from an additional unit of pollution. This may seem like a confusing concept—
All these methods of reducing pollution have an opportunity cost. That is, avoiding pollution requires using scarce resources that could have been employed to produce other goods and services. So the marginal social benefit of pollution is the goods and services that could be had by society if it tolerated another unit of pollution.
Comparisons between the pollution levels tolerated in rich and poor countries illustrate the importance of the level of the marginal social benefit of pollution in deciding how much pollution a society wishes to tolerate. Because poor countries have a higher opportunity cost of resources spent on reducing pollution than richer countries, they tolerate higher levels of pollution. For example, the World Health Organization has estimated that 3.5 million people in poor countries die prematurely from breathing polluted indoor air caused by burning dirty fuels like wood, dung, and coal to heat and cook—
The socially optimal quantity of pollution is the quantity of pollution that society would choose if all the costs and benefits of pollution were fully accounted for.
Using hypothetical numbers, Figure 16-1 shows how we can determine the socially optimal quantity of pollution—the quantity of pollution society would choose if all the social costs and benefits were fully accounted for. The upward-
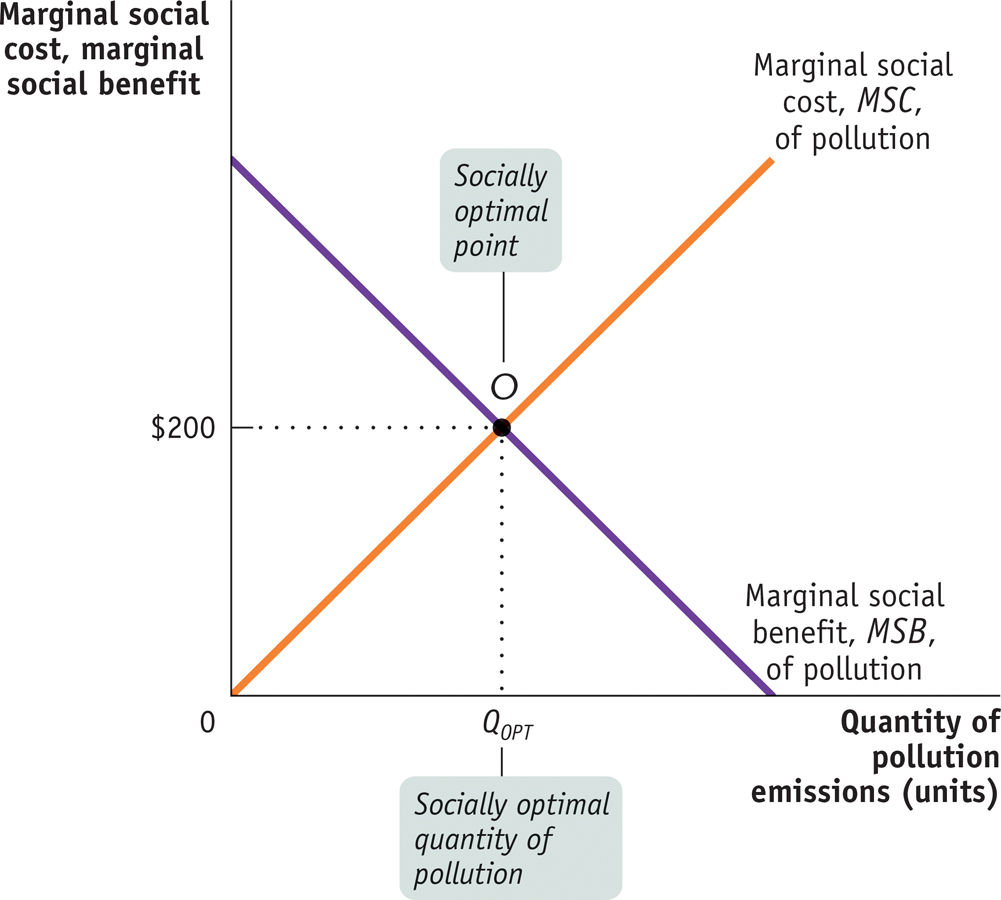
The socially optimal quantity of pollution in this example isn’t zero. It’s QOPT, the quantity corresponding to point O, where MSB crosses MSC. At QOPT, the marginal social benefit from an additional unit of pollution and its marginal social cost are equalized at $200.
But will a market economy, left to itself, arrive at the socially optimal quantity of pollution? No, it won’t.