Shifts of the Factor Demand Curve
As in the case of ordinary demand curves, it is important to distinguish between movements along the factor demand curve and shifts of the factor demand curve. What causes factor demand curves to shift? There are three main causes:
Changes in price of output
Changes in supply of other factors
Changes in technology
1. Changes in Price of Output Remember that factor demand is derived demand: if the price of the good that is produced with a factor changes, so will the value of the marginal product of the factor. That is, in the case of labor demand, if P changes, VMPL = P × MPL will change at any given level of employment.
Figure 19-4 illustrates the effects of changes in the price of wheat, assuming that $200 is the current wage rate. Panel (a) shows the effect of an increase in the price of wheat. This shifts the value of the marginal product of labor curve upward, because VMPL rises at any given level of employment. If the wage rate remains unchanged at $200, the optimal point moves from point A to point B: the profit-
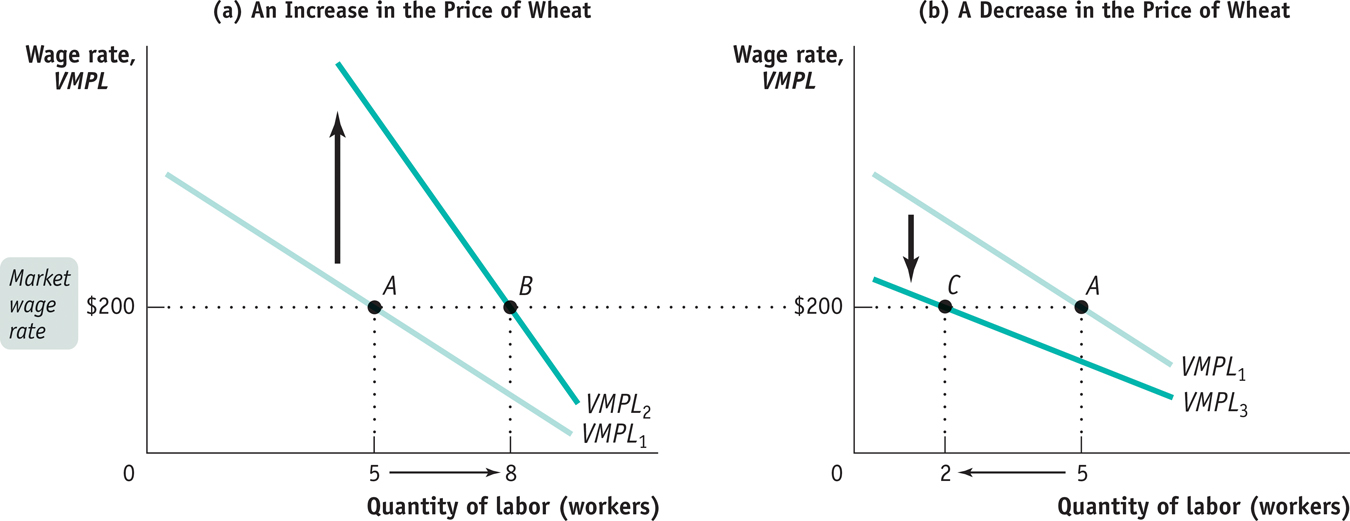
Panel (b) shows the effect of a decrease in the price of wheat. This shifts the value of the marginal product of labor curve downward. If the wage rate remains unchanged at $200, the optimal point moves from point A to point C: the profit-
2. Changes in Supply of Other Factors Suppose that George and Martha acquire more land to cultivate—
In contrast, suppose George and Martha cultivate less land. This leads to a fall in the marginal product of labor at any given employment level. Each worker produces less wheat because each has less land to work with. As a result, the value of the marginal product of labor curve shifts downward—
3. Changes in Technology In general, the effect of technological progress on the demand for any given factor can go either way: improved technology can either increase or reduce the demand for a given factor of production.
How can technological progress reduce factor demand? Consider horses, which were once an important factor of production. The development of substitutes for horse power, such as automobiles and tractors, greatly reduced the demand for horses.
The usual effect of technological progress, however, is to increase the demand for a given factor by raising its productivity. So despite persistent fears that machinery would reduce the demand for labor, over the long run the U.S. economy has seen both large wage increases and large increases in employment. That’s because technological progress has raised labor productivity, and as a result increased the demand for labor.