Trading Risk
It may seem a bit strange to talk about “trading” risk. After all, risk is a bad thing—and aren’t we supposed to be trading goods and services?
But people often trade away things they don’t like to other people who dislike them less. Suppose you have just bought a house for $100,000, the average price for a house in your community. But you have now learned, to your horror, that the building next door is being turned into a nightclub. You want to sell the house immediately and are willing to accept $95,000 for it. But who will now be willing to buy it? The answer: a person who doesn’t really mind late-night noise. Such a person might be willing to pay up to $100,000. So there is an opportunity here for a mutually beneficial deal—you are willing to sell for as little as $95,000, and the other person is willing to pay as much as $100,000, so any price in between will benefit both of you.
The key point is that the two parties have different sensitivities to noise, which enables those who most dislike noise, in effect, to pay other people to make their lives quieter. Trading risk works exactly the same way: people who want to reduce the risk they face can pay other people who are less sensitive to risk to take some of their risk away.
As we saw in the previous section, individual preferences account for some of the variations in people’s attitudes toward risk, but differences in income and wealth are probably the principal reason behind different risk sensitivities. Lloyd’s made money by matching wealthy investors who were more risk-tolerant with less wealthy and therefore more risk-averse shipowners.
Suppose, staying with our Lloyd’s of London story, that a merchant whose ship went down would lose £1,000 and that there was a 10% chance of such a disaster. The expected loss in this case would be 0.10 × £1,000 = £100. But the merchant, whose whole livelihood was at stake, might have been willing to pay £150 to be compensated in the amount of £1,000 if the ship sank. Meanwhile, a wealthy investor for whom the loss of £1,000 was no big deal would have been willing to take this risk for a return only slightly better than the expected loss—say, £110. Clearly, there is room for a mutually beneficial deal here: the merchant pays something less than £150 and more than £110—say, £130—in return for compensation if the ship goes down. In effect, he has paid a less risk-averse individual to bear the burden of his risk. Everyone has been made better off by this transaction.
The funds that an insurer places at risk when providing insurance are called the insurer’s capital at risk.
The funds that an insurer places at risk when providing insurance are called the insurer’s capital at risk. In our example, the wealthy Lloyd’s investor places capital of £1,000 at risk in return for a premium of £130. In general, the amount of capital that potential insurers are willing to place at risk depends, other things equal, on the premium offered. If every ship is worth £1,000 and has a 10% chance of going down, nobody would offer insurance for less than a £100 premium, equal to the expected claim. In fact, only an investor who isn’t risk-averse at all—that is, who is risk-neutral—would be willing to offer a policy at that price, because accepting a £100 premium would leave the insurer’s expected income unchanged while increasing his or her risk.
Suppose there is one investor who is risk-neutral; but the next most willing investor is slightly risk-averse and insists on a £105 premium. The next investor, being somewhat more risk-averse, demands a premium of £110, and so on. By varying the premium and asking how many insurers would be willing to provide insurance at that premium, we can trace out a supply curve for insurance, as shown in Figure 20-3. As the premium increases as we move up the supply curve, more risk-averse investors are induced to provide coverage.

The Supply of Insurance This is the supply of insurance policies to provide £1,000 in coverage to a merchant ship that has a 10% chance of being lost. Each investor has £1,000 of capital at risk. The lowest possible premium at which a policy is offered is £100, equal to the expected claim, and only a risk-neutral investor is willing to supply this policy. As the premium increases, investors who are more risk-averse are induced to supply policies to the market, increasing the quantity of policies supplied.
Meanwhile, potential buyers will consider their willingness to pay a given premium, defining the demand curve for insurance. In Figure 20-4, the highest premium that any shipowner is willing to pay is £200. Who’s willing to pay this? The most risk-averse shipowner, of course. A slightly less risk-averse shipowner might be willing to pay £190, an even slightly less risk-averse shipowner is willing to pay £180, and so on.
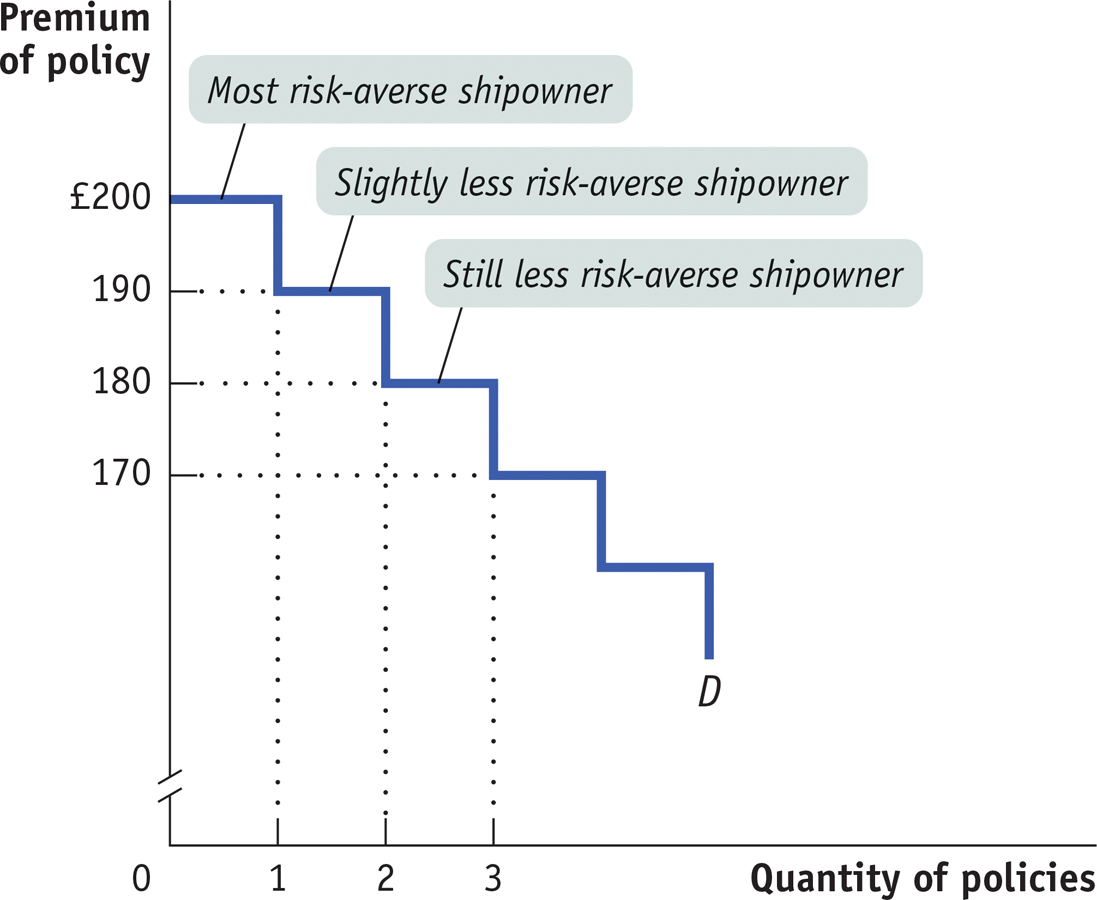
The Demand for Insurance This is the demand for insurance policies for £1,000 in coverage of a merchant ship that has a 10% chance of being lost. In this example, the highest premium at which anyone demands a policy is £200, which only the most risk-averse shipowner will desire. As the premium falls, shipowners who are less risk-averse are induced to demand policies, increasing the quantity of policies demanded.
Now imagine a market in which there are thousands of shipowners and potential insurers, so that the supply and demand curves for insurance are smooth lines. In this market, as in markets for ordinary goods and services, there will be an equilibrium price and quantity. Figure 20-5 illustrates such a market equilibrium at a premium of £130, with a total quantity of 5,000 policies bought and sold, representing a total capital at risk of £5,000,000.
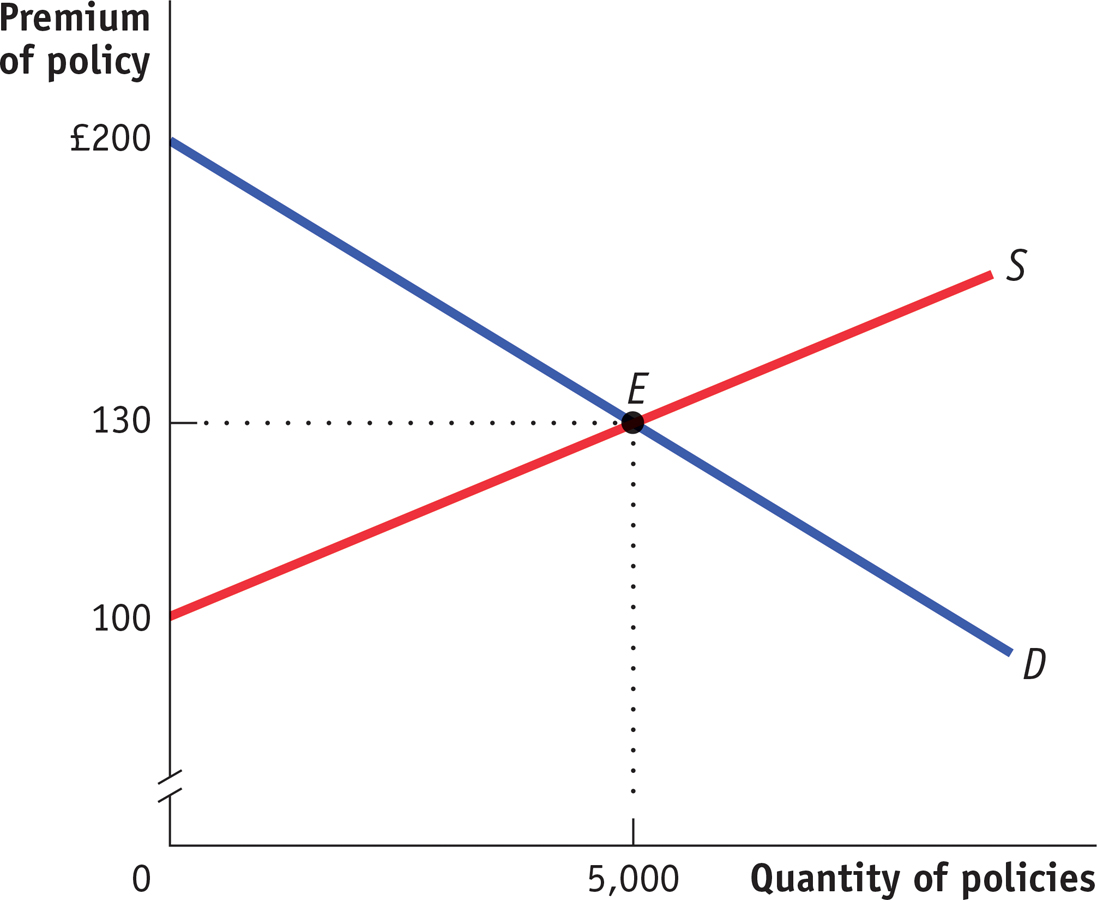
The Insurance Market Here we represent the hypothetical market for insuring a merchant ship, where each ship requires £1,000 in coverage. The demand curve is made up of shipowners who wish to buy insurance, and the supply curve is made up of wealthy investors who wish to supply insurance. In this example, at a premium of £200, only the most risk-averse shipowners will purchase insurance; at a premium of £100, only risk-neutral investors are willing to supply insurance. The equilibrium is at a premium of £130 with 5,000 policies bought and sold. In the absence of private information, (which we explain in the next section), the insurance market leads to an efficient allocation of risk.
An efficient allocation of risk is an allocation of risk in which those who are most willing to bear risk are those who end up bearing it.
Notice that in this market risk is transferred from the people who most want to get rid of it (the most risk-averse shipowners) to the people least bothered by risk (the least risk-averse investors). So just as markets for goods and services typically produce an efficient allocation of resources, markets for risk also typically lead to an efficient allocation of risk—an allocation of risk in which those who are most willing to bear risk are those who end up bearing it. But as in the case of the markets for goods and services, there is an important qualification to this result: there are well-defined cases in which the market for risk fails to achieve efficiency. These arise from the presence of private information, which we will discuss in the next section.
The trading of risk between individuals who differ in their degree of risk aversion plays an extremely important role in the economy, but it is not the only way that markets can help people cope with risk. Under some circumstances, markets can perform a sort of magic trick: they can make some (though rarely all) of the risk that individuals face simply disappear.