Willingness to Pay and the Demand Curve
A used book is not as good as a new book—
A consumer’s willingness to pay for a good is the maximum price at which he or she would buy that good.
Let’s define a potential buyer’s willingness to pay as the maximum price at which he or she would buy a good, in this case a used textbook. An individual won’t buy the good if it costs more than this amount but is eager to do so if it costs less. If the price is just equal to an individual’s willingness to pay, he or she is indifferent between buying and not buying. For the sake of simplicity, we’ll assume that the individual buys the good in this case.
The table in Figure 4-1 shows five potential buyers of a used book that costs $100 new, listed in order of their willingness to pay. At one extreme is Aleisha, who will buy a second-
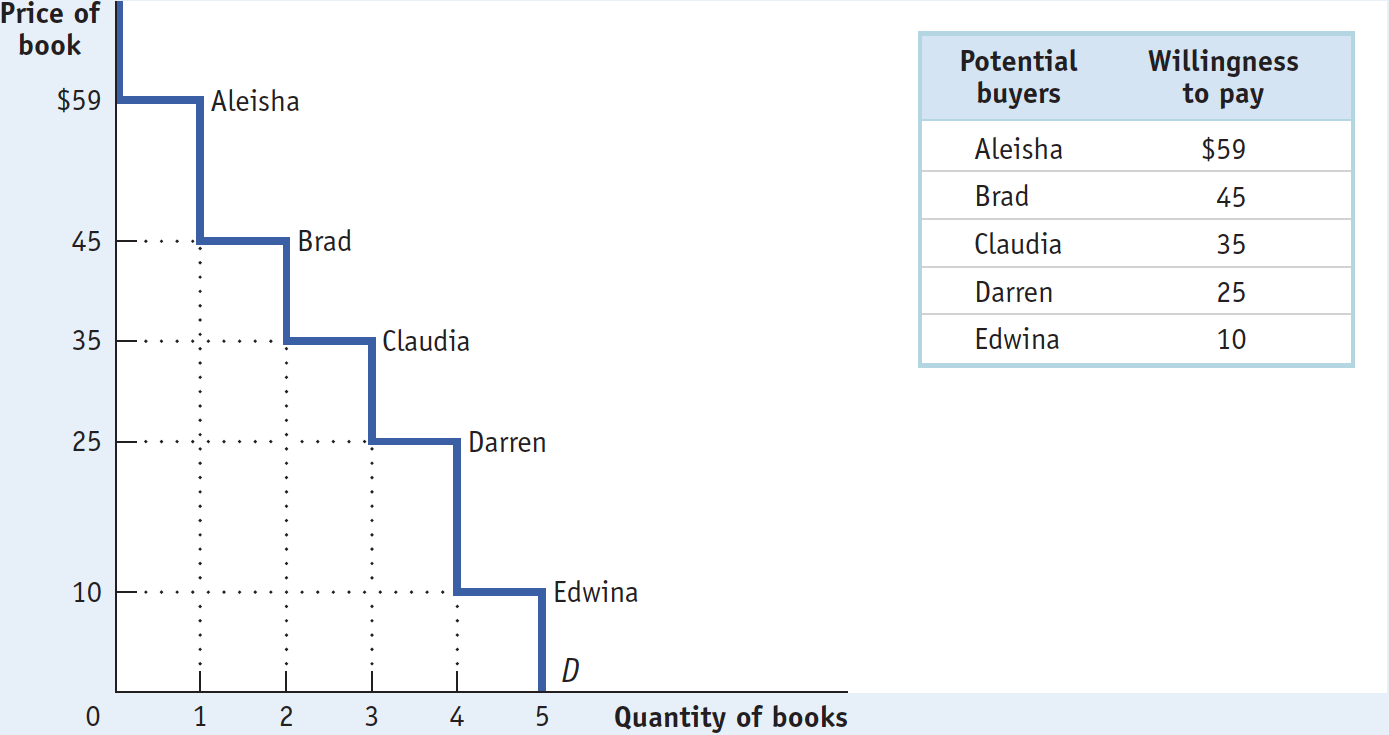
How many of these five students will actually buy a used book? It depends on the price. If the price of a used book is $55, only Aleisha buys one; if the price is $40, Aleisha and Brad both buy used books, and so on. So the information in the table can be used to construct the demand schedule for used textbooks.
As we saw in Chapter 3, we can use this demand schedule to derive the market demand curve shown in Figure 4-1. Because we are considering only a small number of consumers, this curve doesn’t look like the smooth demand curves of Chapter 3, where markets contained hundreds or thousands of consumers. Instead, this demand curve is step-
However, we’ll see shortly that for the analysis of consumer surplus it doesn’t matter whether the demand curve is step-