How Changing Prices Affect Producer Surplus
As with the case of consumer surplus, a change in price alters producer surplus. But the effects are opposite. While a fall in price increases consumer surplus, it reduces producer surplus. And a rise in price reduces consumer surplus but increases producer surplus.
To see this, let’s first consider a rise in the price of the good. Producers of the good will experience an increase in producer surplus, though not all producers gain the same amount. Some producers would have produced the good even at the original price; they will gain the entire price increase on every unit they produce. Other producers will enter the market because of the higher price; they will gain only the difference between the new price and their cost.
Figure 4-9 is the supply counterpart of Figure 4-5. It shows the effect on producer surplus of a rise in the price of wheat from $5 to $7 per bushel. The increase in producer surplus is the sum of the shaded areas, which consists of two parts. First, there is a red rectangle corresponding to the gains to those farmers who would have supplied wheat even at the original $5 price. Second, there is an additional pink triangle that corresponds to the gains to those farmers who would not have supplied wheat at the original price but are drawn into the market by the higher price.
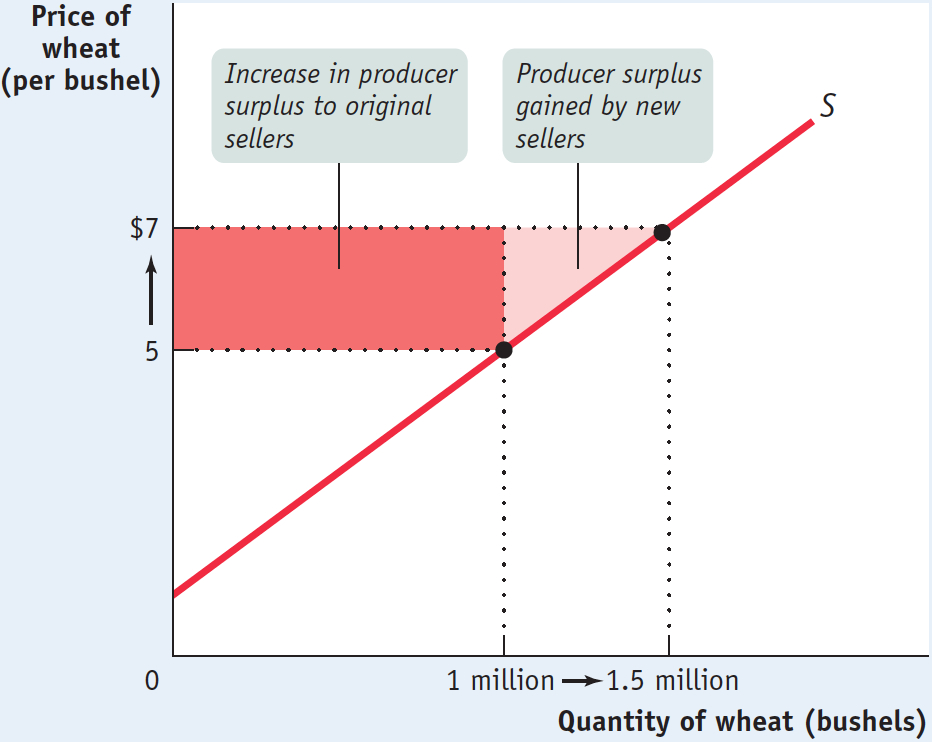
If the price were to fall from $7 to $5 per bushel, the story would run in reverse. The sum of the shaded areas would now be the decline in producer surplus, the decrease in the area above the supply curve but below the price. The loss would consist of two parts, the loss to farmers who would still grow wheat at a price of $5 (the red rectangle) and the loss to farmers who cease to grow wheat because of the lower price (the pink triangle).
!worldview! ECONOMICS in Action: High Times Down on the Farm
High Times Down on the Farm
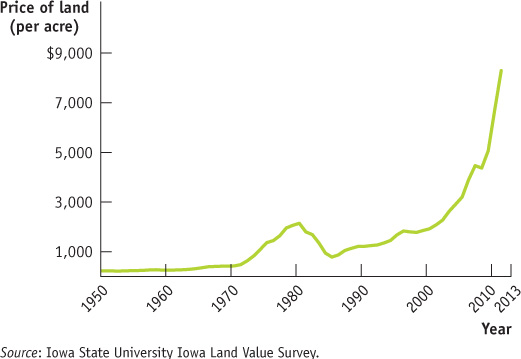
The average value of an acre of Iowa farmland hit a record high of $8,716 in 2013, an increase of 5% from the previous year. This followed three years in a row in which prices had increased by more than 15%. Figure 4-10 shows the explosive increase in the price of Iowa farmland from 2009 to 2013. And there was no mystery as to why: it was all about the high prices being paid for corn, wheat, and soybeans. From 2009 to 2013, the price of corn had jumped by 75%, soybeans by 45%, and wheat by 40%.
Why were Iowa farm products commanding such high prices? There are three main reasons: ethanol, rising incomes in countries like China, and poor weather in other foodstuff-
Ethanol—
But Iowa farmers have also benefited greatly from events in the global economy. Changes in the demand for and supply of foodstuffs in world markets have led to rising prices for American corn, wheat, and soybeans. Rising incomes in countries like China have led to increased food consumption and increased demand for these foodstuffs. Simultaneously, very bad weather in food-
What does this have to do with the price of land? A person who buys a farm in Iowa buys the producer surplus generated by that farm. And higher prices for corn, soybeans, and wheat, which raise the producer surplus of Iowa farmers, make Iowa farmland more valuable. According to an Iowa State University survey, the average price of an acre of Iowa farmland has surged 383% in 10 years.
Quick Review
The supply curve for a good is determined by the cost of each seller.
The difference between the price and cost is the seller’s individual producer surplus.
The total producer surplus is equal to the area above the market supply curve but below the price.
When the price of a good rises, producer surplus increases through two channels: the gains of those who would have supplied the good at the original price and the gains of those who are induced to supply the good by the higher price. A fall in the price of a good similarly leads to a fall in producer surplus.
4-2
Question 4.2
Consider again the market for cheese-
stuffed jalapeno peppers. There are two producers, Cara and Jamie, and their costs of producing each pepper are given in the accompanying table. (Neither is willing to produce more than 4 peppers at any price.) a. Use the accompanying table to construct the supply schedule for peppers for prices of $0.00, $0.10, and so on, up to $0.90. b. Then, calculate the total producer surplus when the price of a pepper is $0.70. Quantity of peppers
Cara’s cost
Jamie’s cost
1st pepper
$0.10
$0.30
2nd pepper
0.10
0.50
3rd pepper
0.40
0.70
4th pepper
0.60
0.90
Solutions appear at back of book.