The Income Elasticity of Demand
The income elasticity of demand is the percent change in the quantity of a good demanded when a consumer’s income changes divided by the percent change in the consumer’s income.
The income elasticity of demand is a measure of how much the demand for a good is affected by changes in consumers’ incomes. It allows us to determine whether a good is a normal or inferior good as well as to measure how intensely the demand for the good responds to changes in income.

Just as the cross-
When the income elasticity of demand is positive, the good is a normal good. In this case, the quantity demanded at any given price increases as income increases.
When the income elasticity of demand is negative, the good is an inferior good. In this case, the quantity demanded at any given price decreases as income increases.
Economists often use estimates of the income elasticity of demand to predict which industries will grow most rapidly as the incomes of consumers grow over time. In doing this, they often find it useful to make a further distinction among normal goods, identifying which are income-
!worldview! FOR INQUIRING MINDS: Will China Save the U.S. Farming Sector
In the days of the Founding Fathers, the great majority of Americans lived on farms. As recently as the 1940s, one American in six—
First, the income elasticity of demand for food is much less than 1—

Second, the demand for food is price-
The combination of these effects explains the long-
That is, up until now. Starting in the mid-
The demand for a good is income-
The demand for a good is income-
The demand for a good is income-
Food’s Bite in World Budgets
If the income elasticity of demand for food is less than 1, we would expect to find that people in poor countries spend a larger share of their income on food than people in rich countries. And that’s exactly what the data show. In this graph, we compare per capita income—
In very poor countries, like Pakistan, people spend a large percent of their income on food. In middle-
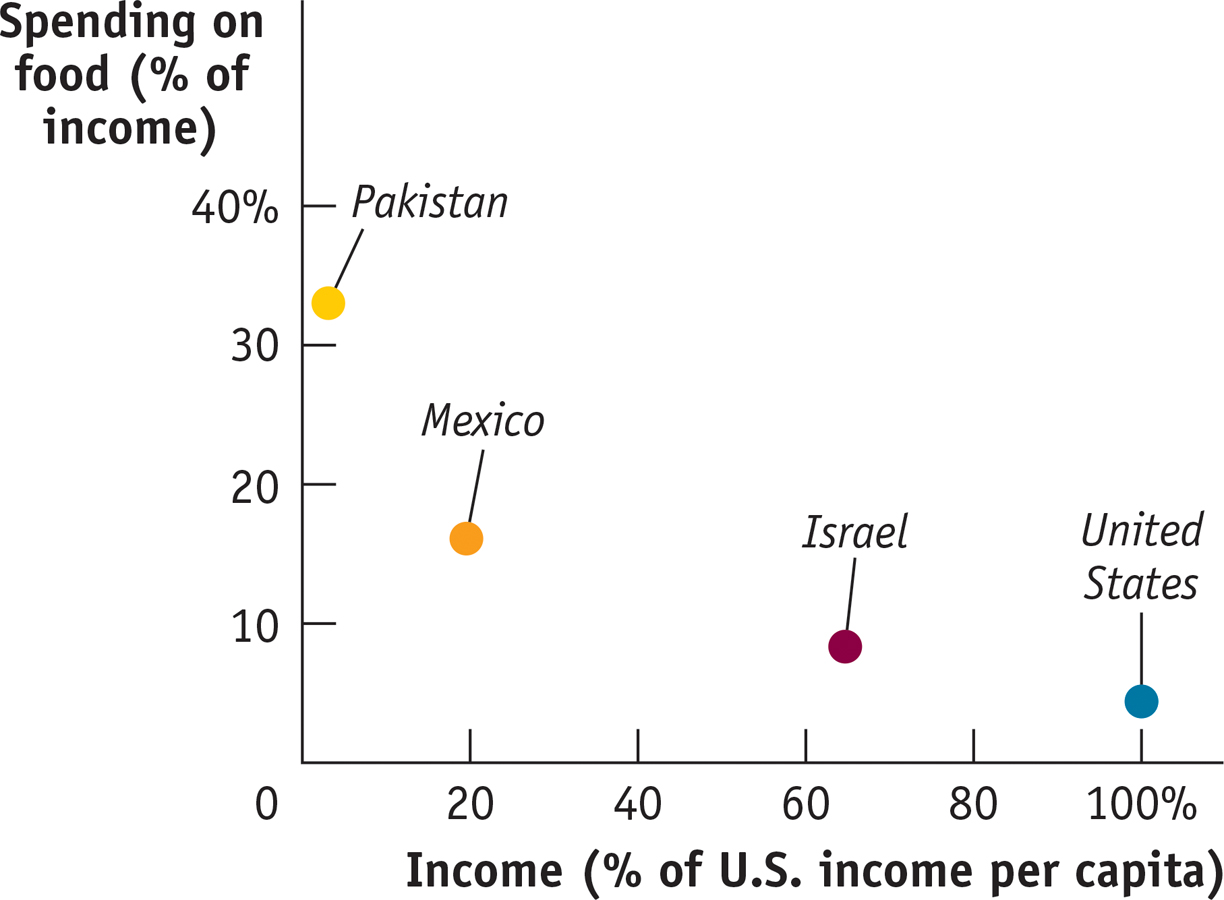
Source: U.S. Department of Agriculture and IMF World Economic Outlook.
ECONOMICS in Action: Spending It
Spending It
The U.S. Bureau of Labor Statistics carries out extensive surveys of how families spend their incomes. This is not just a matter of intellectual curiosity. Quite a few government benefit programs involve some adjustment for changes in the cost of living; to estimate those changes, the government must know how people spend their money. But an additional payoff to these surveys is data on the income elasticity of demand for various goods.
What stands out from these studies? The classic result is that the income elasticity of demand for “food eaten at home” is considerably less than 1: as a family’s income rises, the share of its income spent on food consumed at home falls. Correspondingly, the lower a family’s income, the higher the share of income spent on food consumed at home.

In poor countries, many families spend more than half their income on food consumed at home. Although the income elasticity of demand for “food eaten at home” is estimated at less than 0.5 in the United States, the income elasticity of demand for “food eaten away from home” (restaurant meals) is estimated to be much higher—
Families with higher incomes eat out more often and at fancier places. In 1950, about 19% of U.S. income was spent on food consumed at home, a number that has dropped to 6.1% in 2012. But over the same time period, the share of U.S. income spent on food consumed away from home has stayed constant at 5%. In fact, a sure sign of rising income levels in developing countries is the arrival of fast-
There is one clear example of an inferior good found in the surveys: rental housing. Families with higher income actually spend less on rent than families with lower income, because they are much more likely to own their own homes. And the category identified as “other housing”—which basically means second homes—
Quick Review
Goods are substitutes when the cross-
price elasticity of demand is positive. Goods are complements when the cross- price elasticity of demand is negative. Inferior goods have a negative income elasticity of demand. Most goods are normal goods, which have a positive income elasticity of demand.
Normal goods may be either income-
elastic, with an income elasticity of demand greater than 1, or income- inelastic, with an income elasticity of demand that is positive but less than 1.
6-3
Question 6.6
After Chelsea’s income increased from $12,000 to $18,000 a year, her purchases of album downloads increased from 10 to 40 downloads a year. Calculate Chelsea’s income elasticity of demand for albums using the midpoint method.
Question 6.7
Expensive restaurant meals are income-
elastic goods for most people, including Sanjay. Suppose his income falls by 10% this year. What can you predict about the change in Sanjay’s consumption of expensive restaurant meals? Question 6.8
As the price of margarine rises by 20%, a manufacturer of baked goods increases its quantity of butter demanded by 5%. Calculate the cross-
price elasticity of demand between butter and margarine. Are butter and margarine substitutes or complements for this manufacturer?
Solutions appear at back of book.