Price Elasticity Along the Demand Curve
Suppose an economist says that “the price elasticity of demand for coffee is 0.25.” What he or she means is that at the current price the elasticity is 0.25. In the previous discussion of the toll bridge, what we were really describing was the elasticity at the toll price of $0.90. Why this qualification? Because for the vast majority of demand curves, the price elasticity of demand at one point along the curve is different from the price elasticity of demand at other points along the same curve.
To see this, consider the table in Figure 6-5, which shows a hypothetical demand schedule. It also shows in the last column the total revenue generated at each price and quantity combination in the demand schedule. The upper panel of the graph in Figure 6-5 shows the corresponding demand curve. The lower panel illustrates the same data on total revenue: the height of a bar at each quantity demanded—
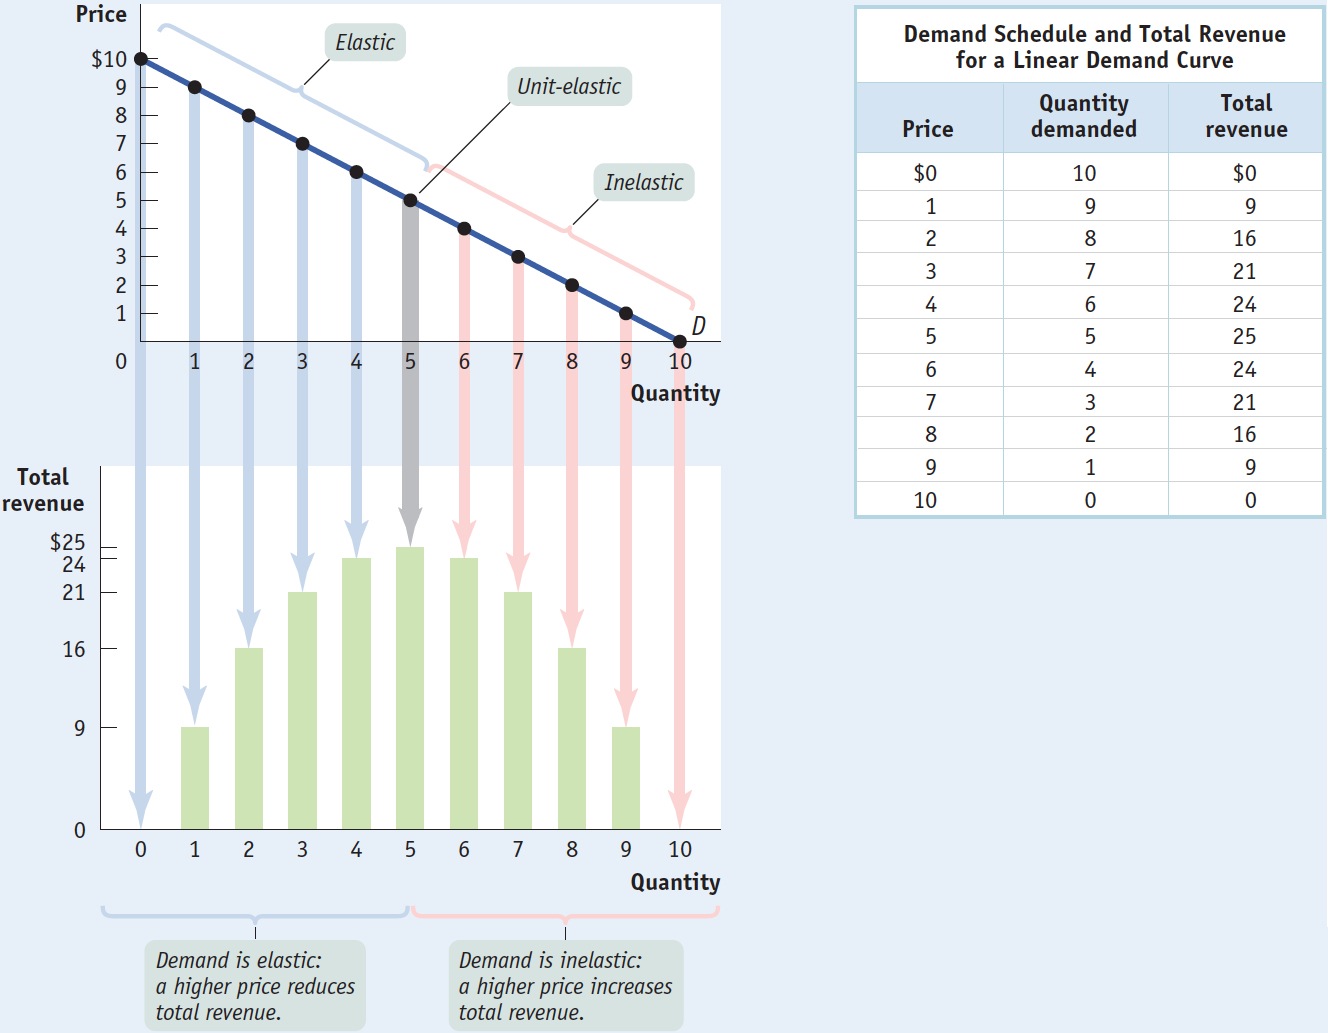
In Figure 6-5, you can see that when the price is low, raising the price increases total revenue: starting at a price of $1, raising the price to $2 increases total revenue from $9 to $16. This means that when the price is low, demand is inelastic. Moreover, you can see that demand is inelastic on the entire section of the demand curve from a price of $0 to a price of $5.
When the price is high, however, raising it further reduces total revenue: starting at a price of $8, raising the price to $9 reduces total revenue, from $16 to $9. This means that when the price is high, demand is elastic. Furthermore, you can see that demand is elastic over the section of the demand curve from a price of $5 to $10.
For the vast majority of goods, the price elasticity of demand changes along the demand curve. So whenever you measure a good’s elasticity, you are really measuring it at a particular point or section of the good’s demand curve.