Marginal Benefit
The marginal benefit of a good or service is the additional benefit derived from producing one more unit of that good or service.
Alex benefits from higher lifetime earnings as he completes more years of school. Exactly how much he benefits is shown in Table 9-5. Column 2 shows Alex’s total benefit according to the number of years of school completed, expressed as the value of his lifetime earnings. The third column shows Alex’s marginal benefit from an additional year of schooling. In general, the marginal benefit of producing a good or service is the additional benefit earned from producing one more unit.
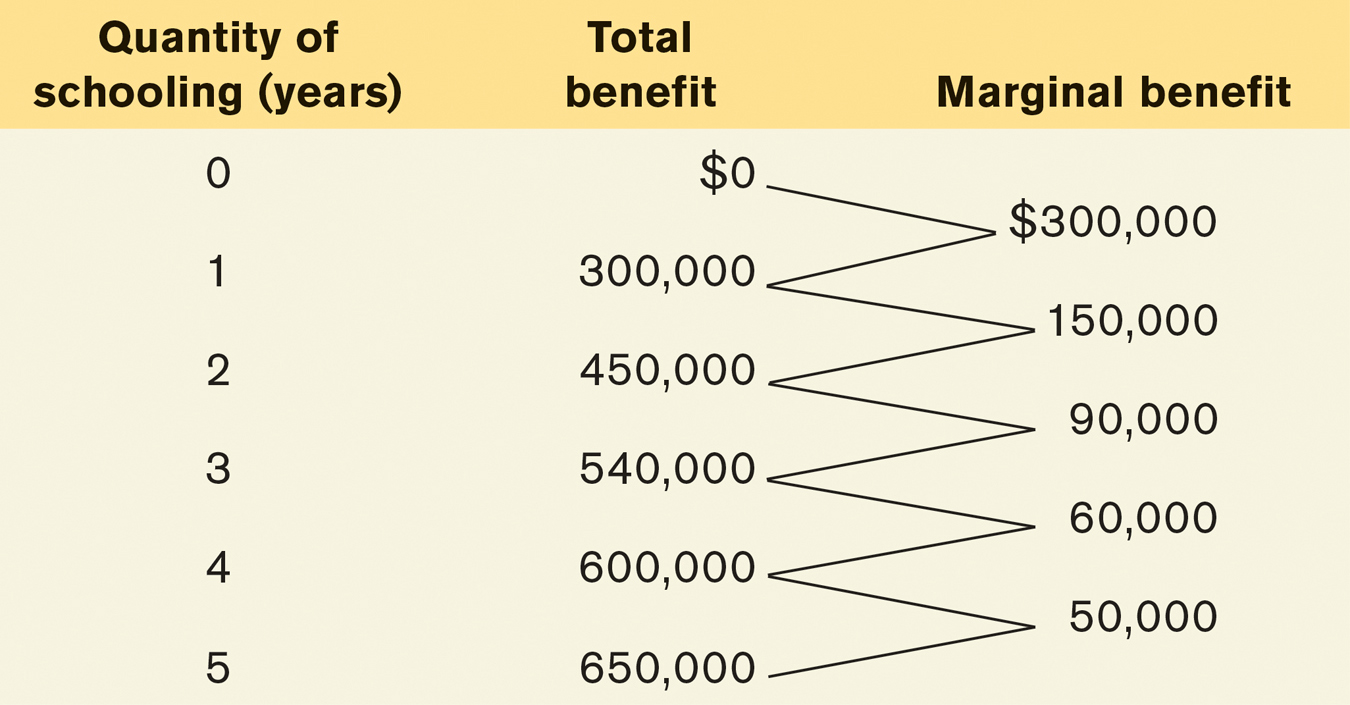
As in Table 9-4, the data in the third column of Table 9-5 show a clear pattern. However, this time the numbers are decreasing rather than increasing. The first year of schooling gives Alex a $300,000 increase in the value of his lifetime earnings. The second year also gives him a positive return, but the size of that return has fallen to $150,000; the third year’s return is also positive, but its size has fallen yet again to $90,000; and so on. In other words, the more years of school that Alex has already completed, the smaller the increase in the value of his lifetime earnings from attending one more year.
There is decreasing marginal benefit from an activity when each additional unit of the activity yields less benefit than the previous unit.
Alex’s schooling decision has what economists call decreasing marginal benefit: each additional year of school yields a smaller benefit than the previous year. Or, to put it slightly differently, with decreasing marginal benefit, the benefit from producing one more unit of the good or service falls as the quantity already produced rises.
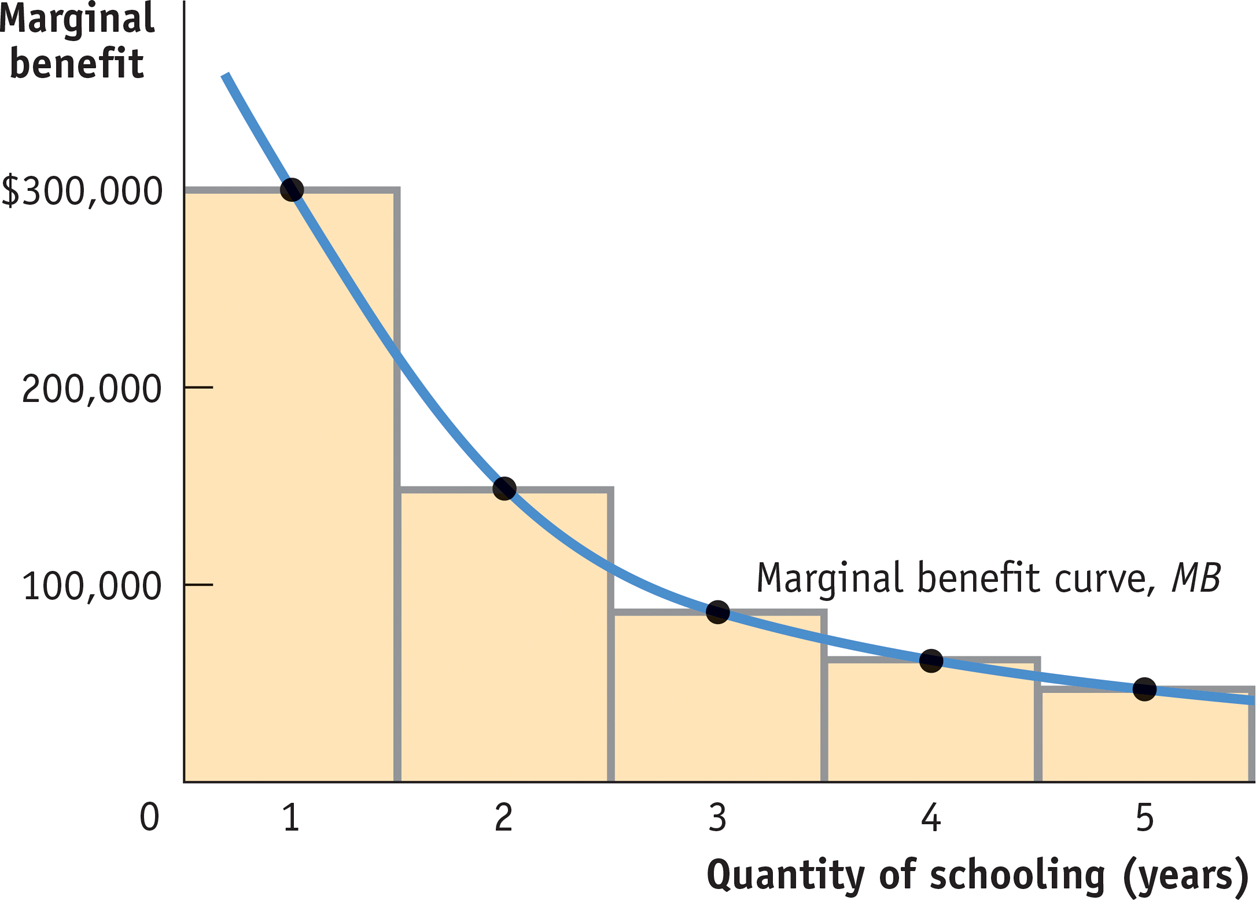
The marginal benefit curve shows how the benefit from producing one more unit depends on the quantity that has already been produced.
Just as marginal cost can be represented by a marginal cost curve, marginal benefit can be represented by a marginal benefit curve, shown in blue in Figure 9-2. Alex’s marginal benefit curve slopes downward because he faces decreasing marginal benefit from additional years of schooling.
Not all goods or activities exhibit decreasing marginal benefit. In fact, there are many goods for which the marginal benefit of production is constant—
Now we are ready to see how the concepts of marginal benefit and marginal cost are brought together to answer the question of how many years of additional schooling Alex should undertake.