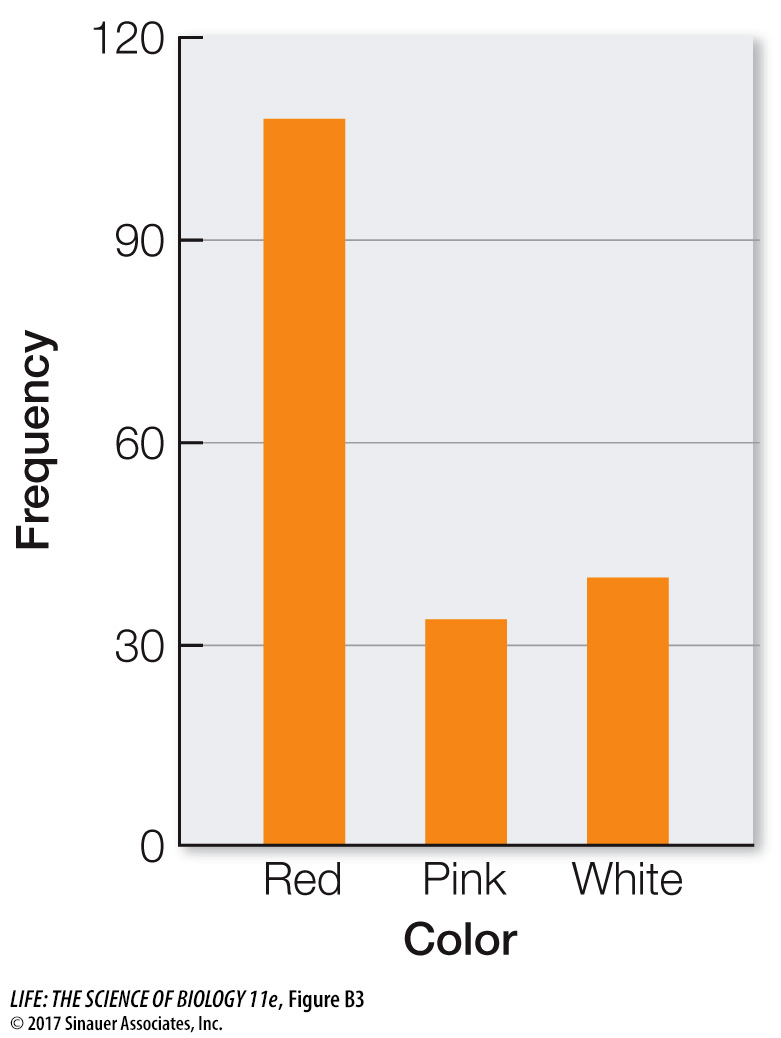
Figure B3
Bar Charts Compare Categorical Data
This bar chart shows the frequency of three poinsettia colors that result from an experimental cross.