image
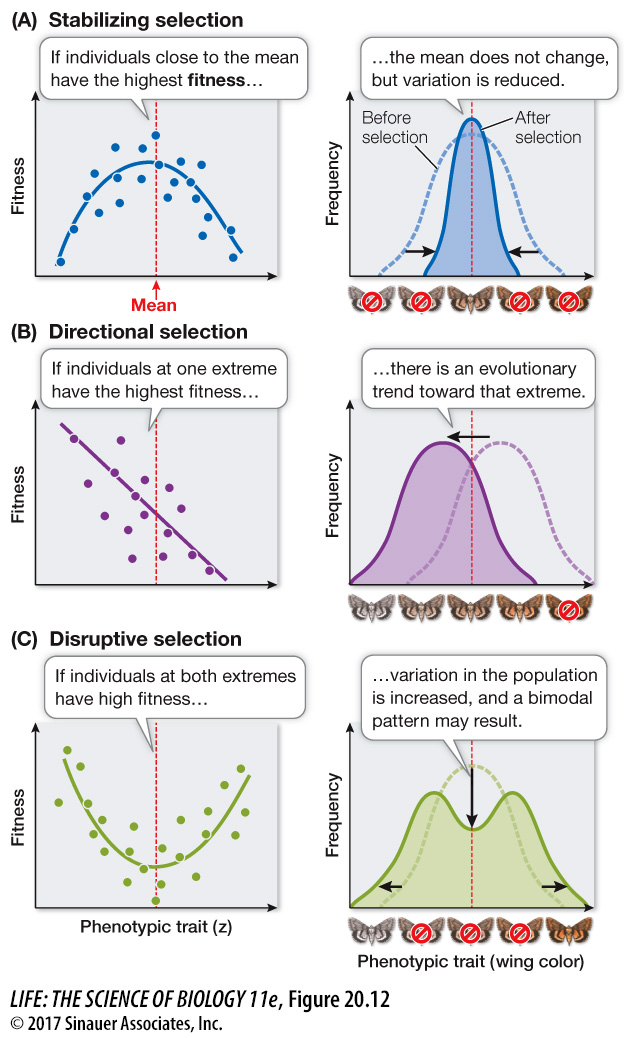
Figure 20.12 Natural Selection Can Operate in Several Ways The graphs in the left-hand column show the fitness of individuals with different phenotypes for the same character. The right-hand graphs show the distribution of the phenotypes in the population before (light green) and after (dark green) the influence of selection.