image
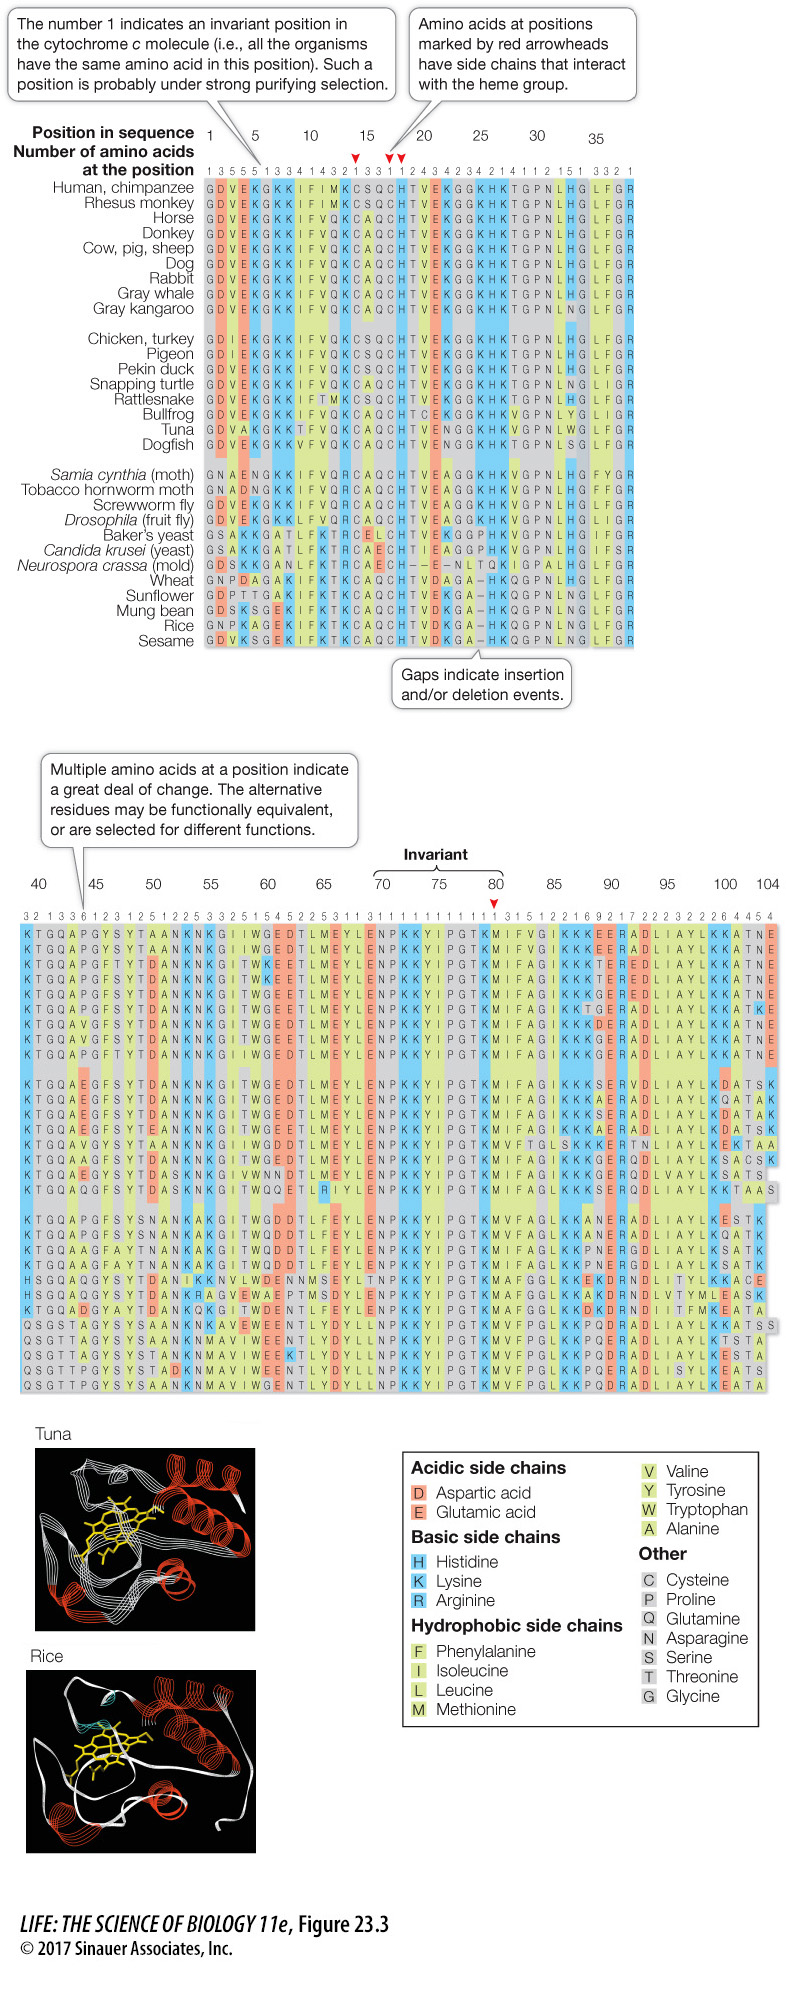
Figure 23.3 Amino Acid Sequences of Cytochrome c The amino acid sequences shown in the table were obtained from analyses of the enzyme cytochrome c from 29 species of plants, fungi, and animals. Note the lack of variation across the sequences at positions 70–80, suggesting that this region is under strong purifying selection and that changing its amino acid sequence would impair the protein’s function. The molecular models at the upper left are created from these sequences and show the three-dimensional structures of tuna and rice cytochrome c. Alpha helixes are in red, and the molecule’s heme group is shown in yellow.