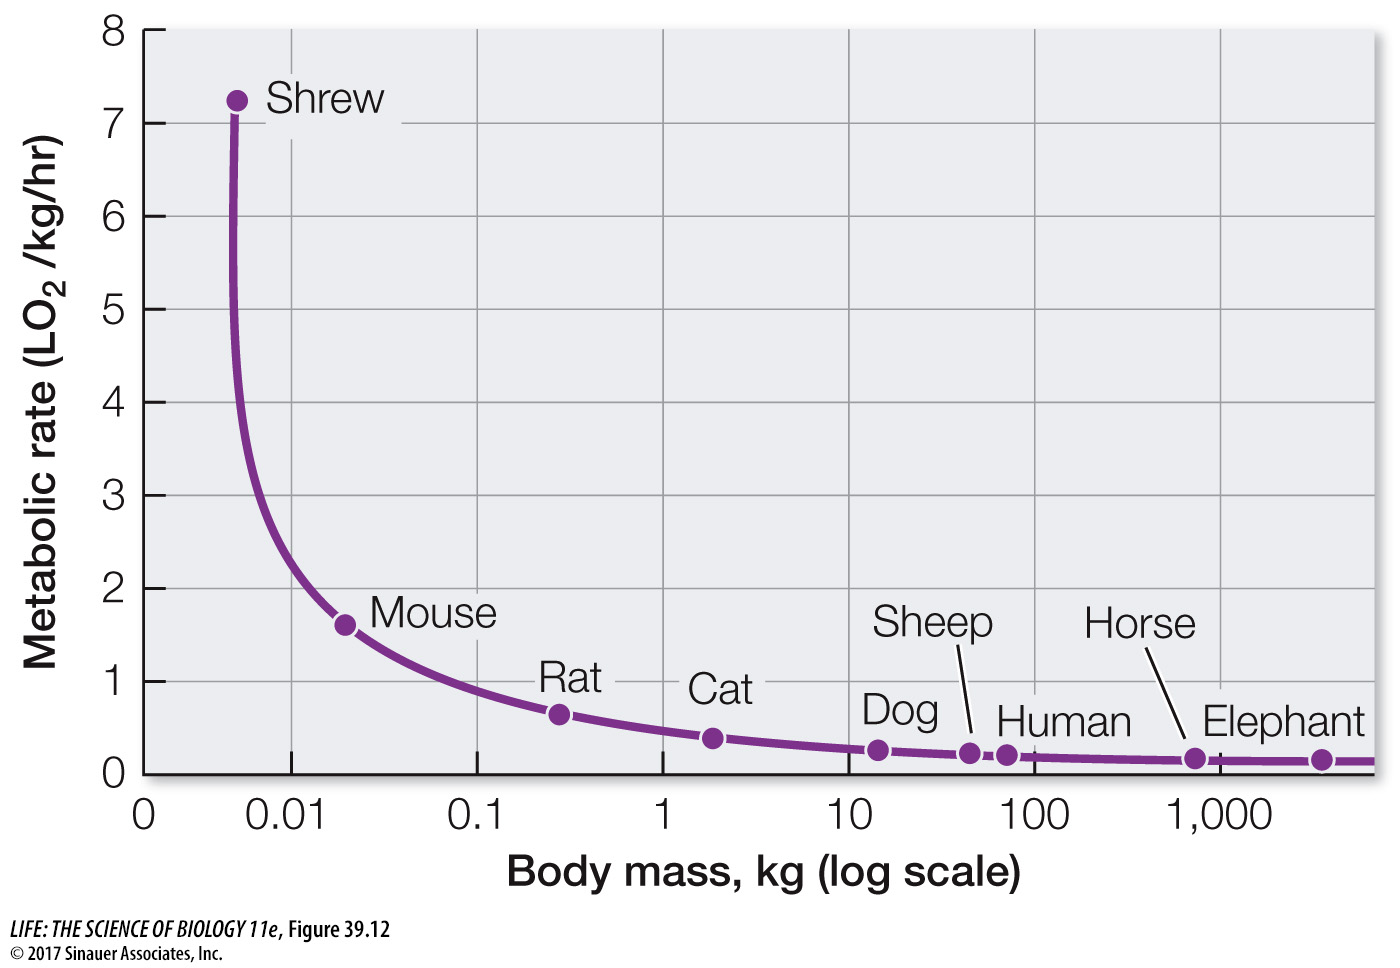
Figure 39.12 The Mouse- to- Elephant Curve On a weight- specific basis, the basal metabolic rate of small endotherms is much greater than that of larger endotherms. This classic illustration, originally published in the 1930s, plots O2 consumption per kilogram of body mass (a measure of metabolic rate) against a logarithmic plot of body mass.