Statistical methods are essential scientific tools
Whether we do comparative or controlled experiments, we have to decide whether there is a real difference between the samples, individuals, groups, or populations in the study. How do we decide whether a measured difference is enough to support or falsify a hypothesis? In other words, how do we decide in an unbiased, objective way that the measured difference is significant?
Significance is measured with statistical methods. Random variation is almost always present in any set of measurements. Statistical tests calculate the probability that the differences observed in an experiment could be due to random variation. The results of statistical tests are therefore probabilities. A statistical test starts with a null hypothesis—the premise that observed differences are the result of random variation that arises from drawing two finite samples from the same population. When quantified observations, or data, are collected, statistical methods are applied to those data to see if there is sufficient evidence to reject the null hypothesis.
14
investigating life
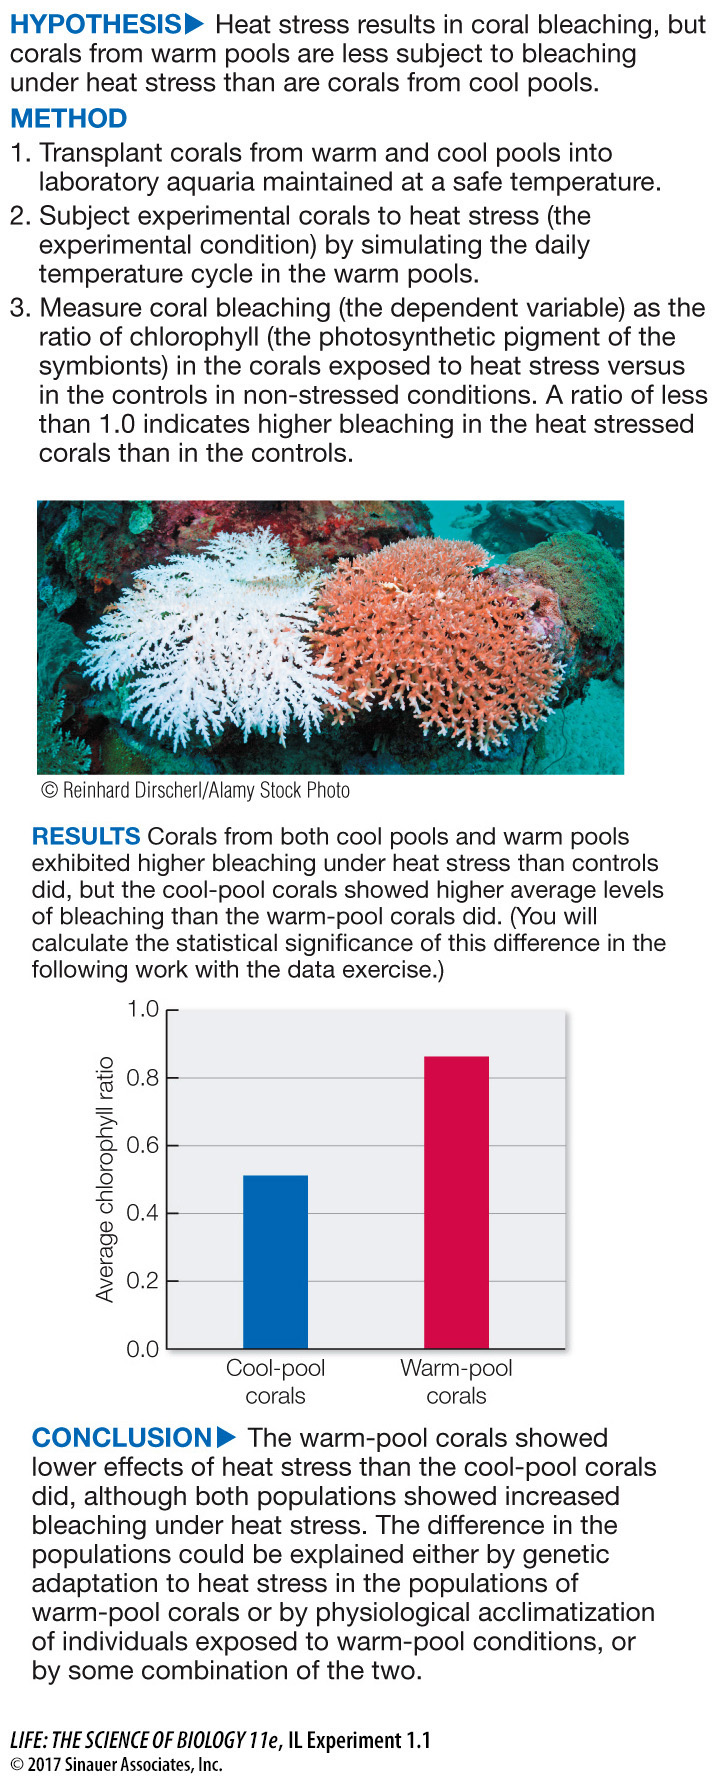
Corals in Hot Water
experiment
Original Paper: Palumbi, S. R., D. J. Barshis, N. Traylor-
Rachael Bay and her colleagues did a controlled experiment by bringing corals from the warm and the cool tidal pools into the laboratory and then subjecting them to cycles of heat stress that simulated the conditions that sometimes occurred in the warm tidal pools. The outcome measure was bleaching—
work with the data
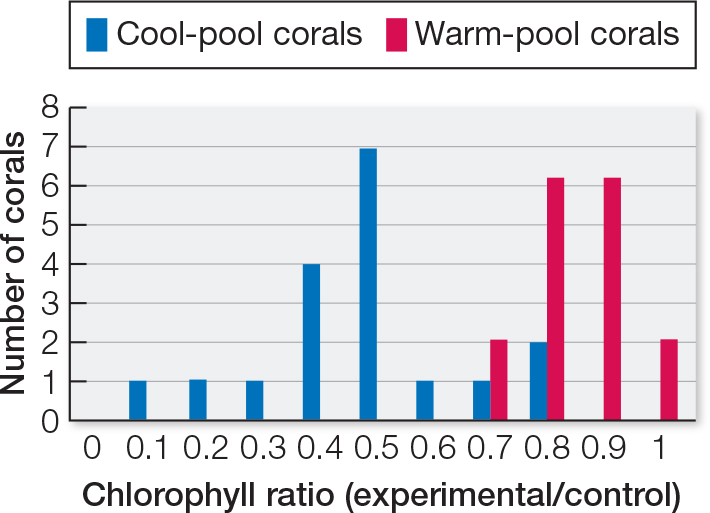
The bar graph in the Results section of the experiment shows that both cool-
| Average chlorophyll ratio |
Cool- corals |
Warm- corals |
|---|---|---|
| 0.0 | 0 | 0 |
| 0.1 | 0 | 0 |
| 0.2 | 1 | 0 |
| 0.3 | 1 | 0 |
| 0.4 | 4 | 0 |
| 0.5 | 7 | 0 |
| 0.6 | 1 | 0 |
| 0.7 | 1 | 1 |
| 0.8 | 2 | 3 |
| 0.9 | 0 | 3 |
| 1.0 | 0 | 1 |
QUESTIONS
Question 1
Prepare a bar graph based on these data. Display the chlorophyll ratios on the x axis, and show the number of corals that exhibited each ratio on the y axis.
Question 2
First, let’s consider if there is a significant effect of heat stress in each of the two groups. At the outset we assume that there is no effect of heat stress in either group—
For the cool-
15
Question 3
Now let’s consider if there is a significant difference in the level of bleaching in the cool-
The results of the randomization trials will differ depending on how well the cards are shuffled and how many replicates are compared, but the probability of finding a difference as great as 0.35 (the observed difference) in truly randomized samples of the two groups is very low (P < 0.001). Therefore we can again reject the null hypothesis and conclude that the effects of heat stress on coral bleaching are indeed higher in the corals from cool pools than in those from warm pools.
Question 4
What do these results suggest about the possible response of coral populations in different environments to ocean warming?
The different distributions of chlorophyll ratios for the cool-
A similar work with the data exercise may be assigned in LaunchPad.
More specifically, statistical methods tell us the probability of obtaining the same results by chance even if the null hypothesis were true. We need to eliminate, insofar as possible, the chance that any differences showing up in the data are merely the result of random variation in the samples tested. Scientists generally conclude that the differences they measure are significant if statistical tests show that the probability of error (that is, the probability that a difference as large as the one observed could be obtained by mere chance) is 5 percent or lower. They often use more stringent criteria for rejecting the null hypothesis, however, depending on the consequences of accepting a wrong hypothesis. Appendix B of this book offers a short primer on statistical methods to which you can refer as you analyze data that will be presented throughout the text.