Apply What You’ve Learned
109
Review
5.1 Membranes provide a structural role in a cell and also allow the cell to maintain homeostasis and communicate with other cells.
5.1 Microscopy allows visual examination of cells.
5.3 Each organelle carries out a different specific function that, when combined with others, allows the cell to function as a whole.
Original Paper: Hirschberg, K. et al. 1998. Kinetic analysis of secretory protein traffic and characterization of Golgi to plasma membrane transport intermediates in living cells. The Journal of Cell Biology 143: 1485–
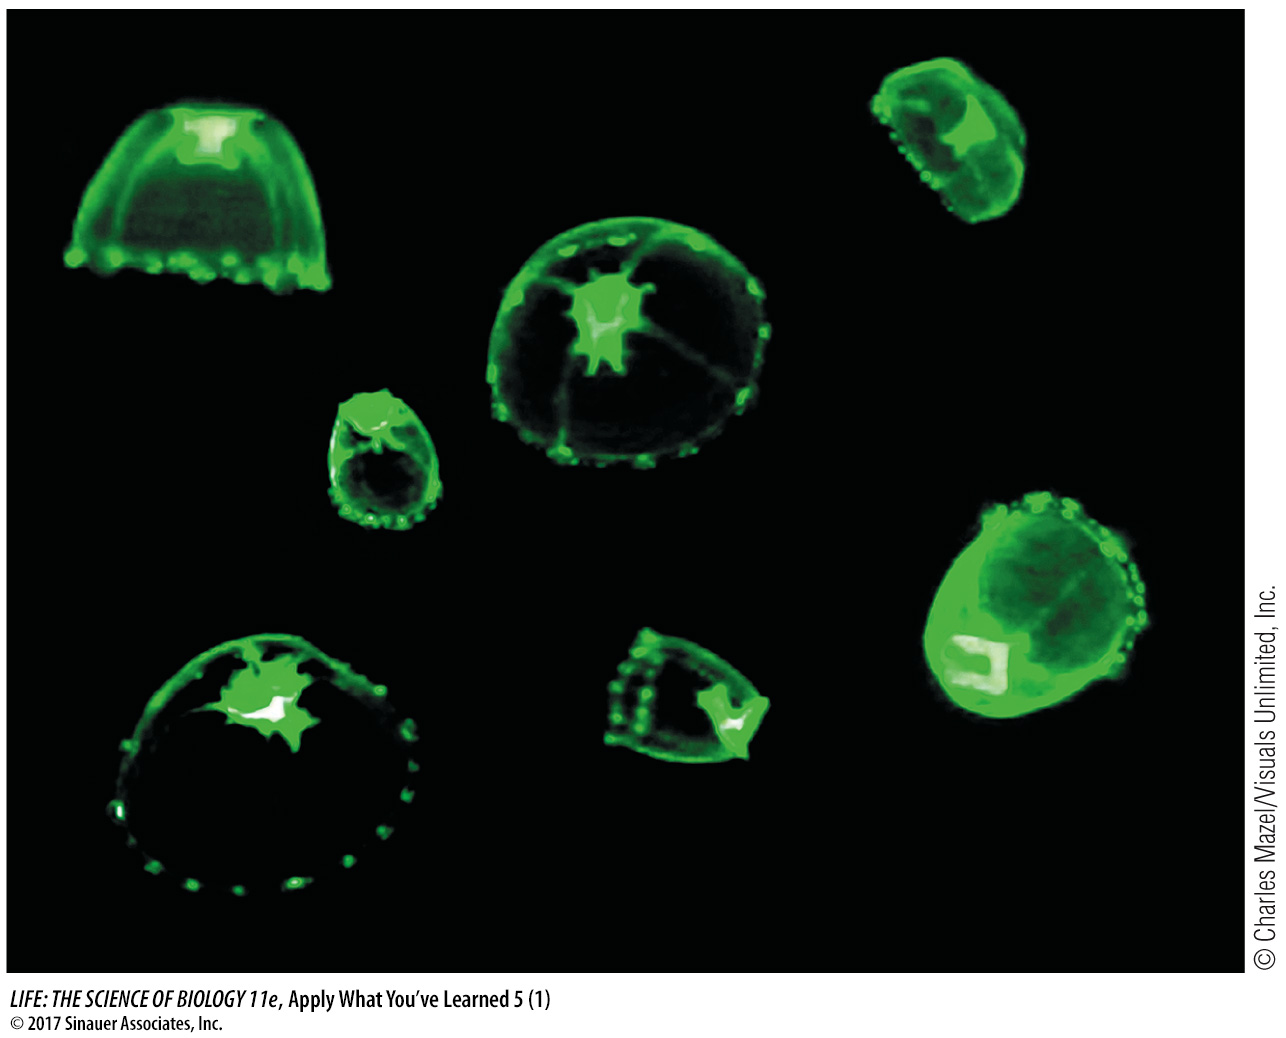
Some proteins naturally emit light. One example is green fluorescent protein found in the jellyfish Aequorea victoria, which emits a green glow from the rim of its circular body. Scientists are not sure what biological role green fluorescent protein plays in the jellyfish, though one hypothesis is that the light scares off predators. While research on this question is ongoing, green fluorescent protein has been put to work as a useful biological tool. The gene encoding the protein has been isolated and small portions of it linked to genes encoding proteins from other organisms. Expression of these fused genes produces “fusion proteins” that retain their normal biological functions but have fluorescent tags that allow the proteins to be tracked.
Researchers followed such a fusion protein through a mammalian cell using microscopy. They fused genetic sequences from green fluorescent protein to the gene encoding a protein from a virus. When this virus infects a cell, it directs the cell to make this protein and insert it into the cell membrane. The membrane is used to package new viruses. By choosing this protein, the researchers identified a nice system for following a protein’s movements through a cell. They used a microscope outfitted with fluorescence imaging equipment to observe changes after infecting the cell with virus. The table below summarizes the results.
| Relative fluorescence intensity | ||||
|---|---|---|---|---|
| Time (min) |
ER | Golgi apparatus |
Cell membrane |
Total |
| 0 | 0.95 | 0.05 | 0.00 | 1.00 |
| 20 | 0.64 | 0.28 | 0.08 | 1.00 |
| 40 | 0.38 | 0.39 | 0.23 | 1.00 |
| 60 | 0.17 | 0.38 | 0.44 | 0.99 |
| 80 | 0.05 | 0.28 | 0.65 | 0.98 |
| 100 | 0.00 | 0.25 | 0.70 | 0.95 |
| 150 | 0.00 | 0.05 | 0.77 | 0.82 |
| 200 | 0.00 | 0.00 | 0.75 | 0.75 |
Questions
Question 1
Create a graph plotting the fluorescence intensity versus time for each category. Use the results to describe the pathway taken by the protein.
The results show that the protein begins its path in the endoplasmic reticulum, passes through the Golgi apparatus, and ends up in the cell membrane. 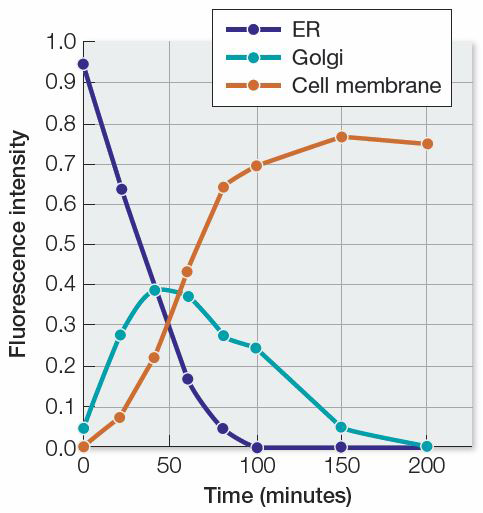
Question 2
Suppose that the mammalian cells had been given a molecule that inhibited protein synthesis at the same time they were inoculated with the virus carrying the gene for the fusion protein. How would this have affected the results of the experiment?
An inhibitor of protein synthesis would have prevented the fusion protein from being synthesized. Very little fluorescence (if any) would have been observed, and no fluorescence would have been observed moving into the Golgi apparatus or cell membrane.
Question 3
Another way to track the tagged protein is cell fractionation. If cells are infected with the virus and at various times ruptured and cell fractions isolated by centrifugation, the fluorescent protein can be identified in specific fractions at each time point. Would the researchers have learned anything different using this method? Explain.
The researchers would not have learned anything new because the cell fractionation method would have provided the same information about changes in subcellular locations of fluorescence over time. However, the results should have confirmed what was found using microscopy, which can provide additional weight of evidence for making claims about the path of the protein.
Question 4
Green fluorescent protein is not the only fluorescent protein that biologists have used as a tag for following proteins. How do you think researchers could use fluorescent tagging to follow two different proteins simultaneously in the same cell? Could the researchers use this to show how two proteins end up in different locations?
The researchers would have to use two different fluorescent tags that glow with different colors (e.g., green and red) so they could be distinguished from each other. Then the equipment used to collect data could be tuned to each color, and data collected at each color simultaneously.
Question 5
Create a graph or table to predict the results of an experiment in which researchers follow the fates of two proteins after they are made on ribosomes in the rough ER: a secretory protein destined to be secreted by the cell and a peroxidase destined for the peroxisome.
As long as the two fluorescent tags on the different proteins can be distinguished from each other, they can be followed along different paths in the cell. The peroxidase would be expected to move from the ER to the Golgi apparatus to the peroxisome, while the secretory protein would be expected to move from the ER to the Golgi apparatus to the extracellular fluid. The two proteins would be found in the same compartments only in the ER and Golgi apparatus and would part ways as they entered different final destinations.
| Peroxidase | Secretory Protein | |||||||
|---|---|---|---|---|---|---|---|---|
| Time (min) | ER | Golgi apparatus | Peroxisome | Extracellular fluid | ER | Golgi apparatus | Peroxisome | Extracellular fluid |
| 0 | 1.0 | 0.0 | 0.0 | 0.0 | 1.0 | 0.0 | 0.0 | 0.0 |
| 10 | 0.6 | 0.3 | 0.1 | 0.0 | 0.6 | 0.3 | 0.0 | 0.1 |
| 20 | 0.4 | 0.4 | 0.2 | 0.0 | 0.4 | 0.4 | 0.0 | 0.2 |
| 50 | 0.2 | 0.3 | 0.5 | 0.0 | 0.2 | 0.3 | 0.0 | 0.5 |
| 100 | 0.1 | 0.2 | 0.7 | 0.0 | 0.1 | 0.2 | 0.0 | 0.7 |
| 200 | 0.0 | 0.0 | 1.0 | 0.0 | 0.0 | 0.0 | 0.0 | 1.0 |