Linked genes are inherited together
Some of the crosses Morgan performed with fruit flies yielded phenotypic ratios that were not in accordance with those predicted by Mendel’s law of independent assortment. Morgan crossed Drosophila with known genotypes at two loci, B and Vg:
B (wild-
type gray body) is dominant over b (black body). Vg (wild-
type wing) is dominant over vg (vestigial, a very small wing).
Morgan first made an F1 generation by crossing homozygous dominant BBVgVg flies with homozygous recessives (bbvgvg). He then performed a test cross with the F1 flies: BbVgvg × bbvgvg.1 Morgan expected to see four phenotypes in a ratio of 1:1:1:1, but that is not what he observed. The body color gene and the wing size gene were not assorting independently; rather, they were usually inherited together (Figure 12.15).
experiment
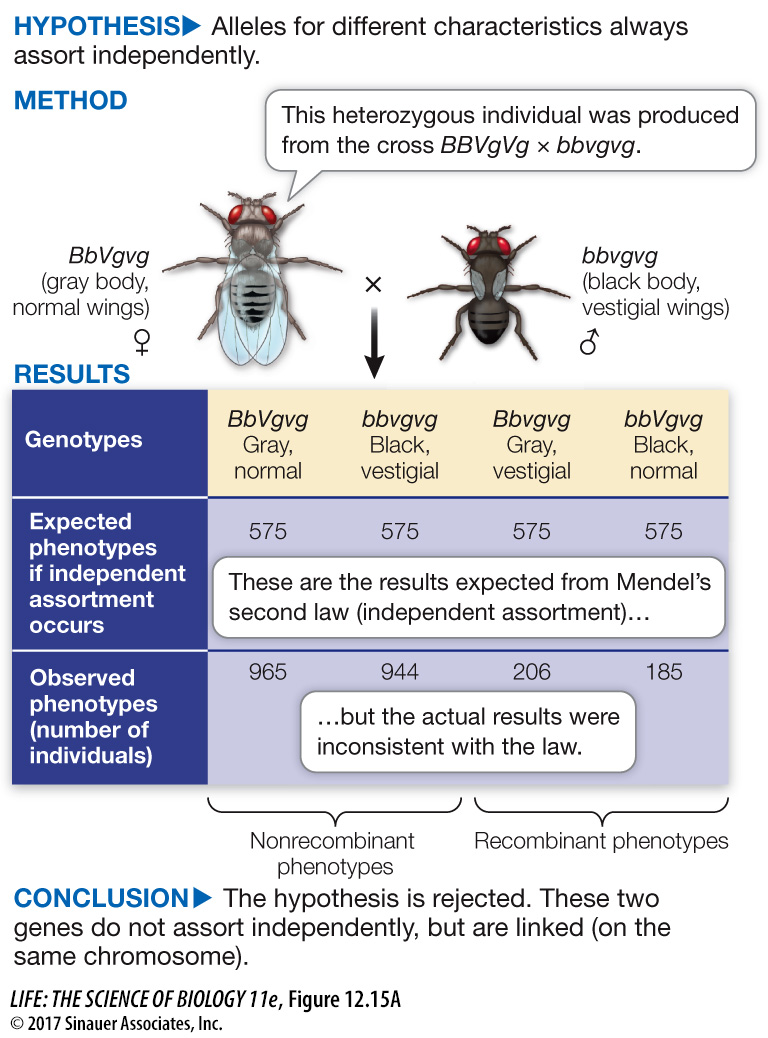
Figure 12.15A Some Alleles Do Not Assort Independently
Original Paper: Morgan, T. H. 1912. Complete linkage in the second chromosome of Drosophila. Science 36: 719–
Morgan’s studies showed that the genes for body color and wing size in Drosophila are linked, so that their alleles do not assort independently.
1Do you recognize this type of cross? It is a test cross for the two gene pairs; see Figure 12.3.
257
work with the data
Figure 12.15B Some Alleles Do Not Assort Independently
Original Paper: Morgan, T. H. 1912.
Mendel’s work was “rediscovered” 40 years after its publication. At that time, biologists began to find some exceptions to the rules of inheritance that Mendel had proposed. Thomas Hunt Morgan and his colleagues made dihybrid test crosses in fruit flies. They proposed that the clearest way to test for linkage was not to look at aberrations in the 9:3:3:1 phenotypic ratio expected from an F1 × F1 cross, but to examine aberrations in the 1:1:1:1 ratio expected from an F1 × homozygous recessive test cross (see Figure 12.3). Morgan’s group then hypothesized that linkage had a physical basis, namely that genes are linked together on chromosomes and that rare crossing over during meiosis gives rise to the less frequent phenotypes. Examination of actual chromosomal events confirmed this.
QUESTIONS
Question 1
Morgan first performed a dihybrid cross between black, normal-
Using a chi-
Question 2
To quantify linkage, Morgan crossed homozygous black, normal-
The genes are linked, because there more parental type phenotypes and fewer recombinant (non-
The map distance is:
[(578 + 307) / (578 + 307 + 1413 + 1117)] x 100 = 26 map units
These data are different from the data shown in Figure 12.17, because the parental types are different: black normal and grey vestigial in this cross, and grey normal and black vestigial in Figure 12.17.
Question 3
In a third experiment, Morgan crossed two genetic strains of flies that were homozygous for the body color and wing genes. The F1 flies were all gray and normal-
| Number of progeny showing each phenotype | ||||
|---|---|---|---|---|
| Experiment | Gray, normal |
Black, normal |
Gray, vestigial |
Black, vestigial |
| 1 | 2,316 | 1,146 | 737 | 0 |
| 2 | 578 | 1,413 | 1,117 | 307 |
| 3 | 246 | 9 | 65 | 18 |
BBVgVg and bbvgvg
A similar work with the data exercise may be assigned in LaunchPad.
Morgan knew about chromosomes and meiosis. To explain the data, he proposed that the two Drosophila loci are on the same chromosome—