Molecular clocks help date evolutionary events
For many applications, biologists want to know not only the order in which evolutionary lineages split but also the timing of those splits. In 1965, Emile Zuckerkandl and Linus Pauling hypothesized that rates of molecular change were constant enough that they could be used to predict evolutionary divergence times—an idea that has become known as the molecular clock hypothesis.
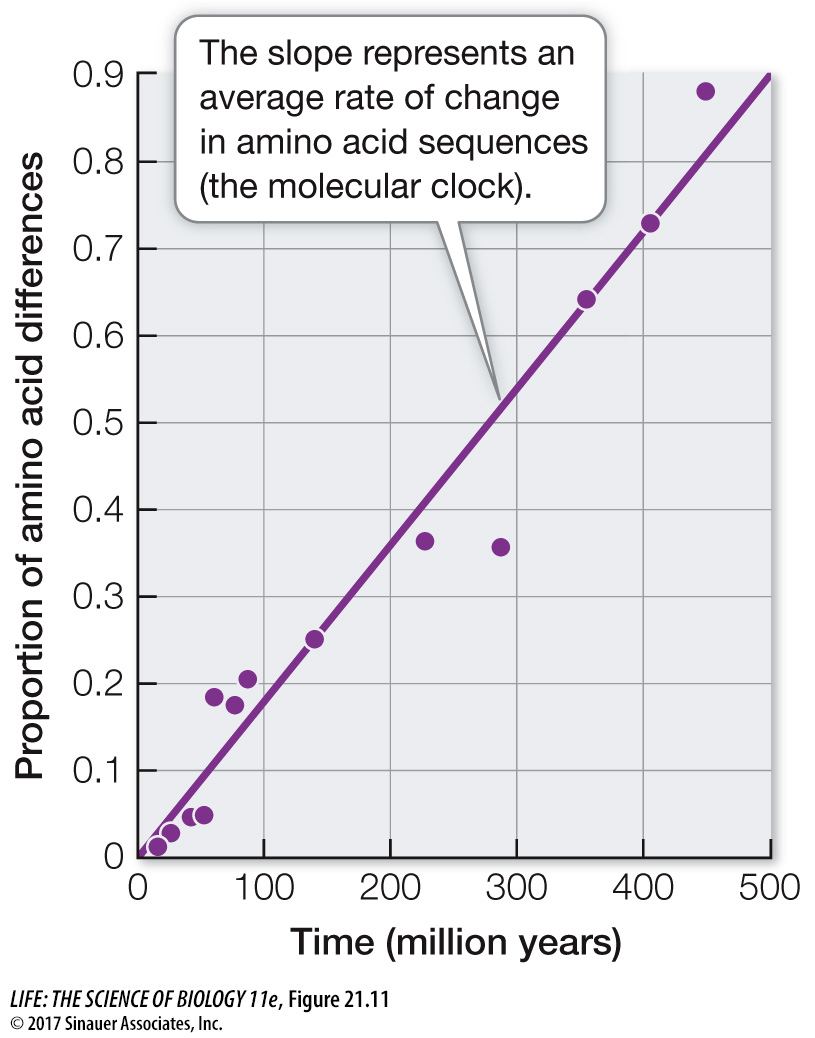
Of course, different genes evolve at different rates, and there are also differences in evolutionary rates among species related to differing generation times, environments, efficiencies of DNA repair systems, and other biological factors. Nonetheless, among closely related species, a given gene usually evolves at a reasonably constant rate. Therefore the protein encoded by the gene accumulates amino acid replacements at a relatively constant rate (Figure 21.11). A molecular clock uses the average rate at which a given gene or protein accumulates changes to gauge the time of divergence for a particular split in the phylogeny. Molecular clocks must be calibrated using independent data, such as the fossil record, known times of divergence, or biogeographic dates (e.g., the time of separations of continents). Using such calibrations, times of divergence have been estimated for many groups of species that have diverged over millions of years.

Figure 21.11 A Molecular Clock for the Protein Hemoglobin Amino acid replacements in hemoglobin have occurred at a relatively constant rate over nearly 500 million years of evolution. The graph shows the relationship between the time of divergence and the proportion of amino acids that have changed for 13 pairs of vertebrate hemoglobin proteins. The average rate of change represents the molecular clock for hemoglobin in vertebrates.
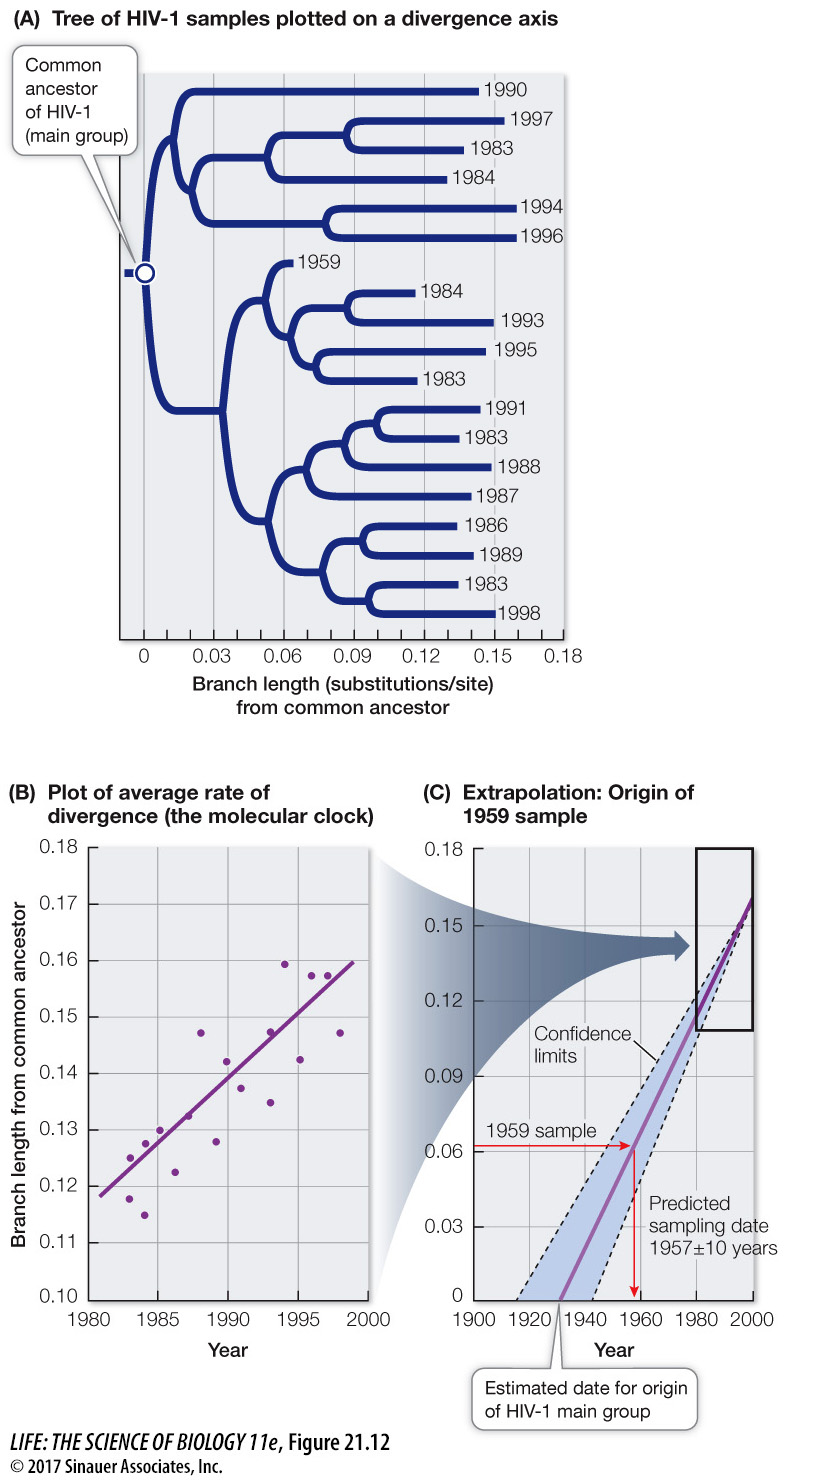
Molecular clocks are not only used to date ancient events; they are also used to study the timing of comparatively recent events. Most samples of HIV-1 have been collected from humans only since the early 1980s, although a few isolates from medical biopsies are available from as early as the 1950s. Biologists can use the observed changes in HIV-1 over the past several decades to project back to the common ancestor of all HIV-1 isolates, and estimate when HIV-1 first entered human populations from chimpanzees (Figure 21.12). This molecular clock was calibrated using the samples from the 1980s and 1990s, and then tested using the samples from the 1950s. As shown in Figure 21.12C, a sample from a 1959 biopsy is dated by molecular clock analysis at 1957 ± 10 years. Extrapolation back to the common ancestor of the samples suggested a date of origin for this group of viruses of about 1930. Although AIDS was unknown to Western medicine until the 1980s, this analysis shows that HIV-1 was present (probably at a very low frequency) in human populations in Africa for at least a half-century before its emergence as a global pandemic. Biologists have used similar analyses to conclude that immunodeficiency viruses have been transmitted repeatedly into human populations from multiple primates for more than a century (see also Figure 21.7).

Figure 21.12 Dating the Origin of HIV-1 in Human Populations (A) A phylogenetic tree for samples of the main group of HIV-1 virus. The dates indicate the years in which the samples were taken. (For clarity, only a small fraction of the samples that were examined in the original study are shown.) (B) A plot of sample year versus genetic divergence from the common ancestor provided an average rate of divergence, or a molecular clock. (C) The molecular clock was used to date a sample taken in 1959 (as a test of the clock) and to estimate the date of origin of the HIV-1 main group (about 1930). Branch length from a common ancestor represents the average number of substitutions per nucleotide.
Question
Q: What would be the expected branch length from the common ancestor of an HIV isolate from 1970?
The expected branch length would be about 0.09 substitutions per nucleotide.

