recap
461
21.3 recap
Phylogenetic trees are used to reconstruct the evolutionary history of lineages, to determine when and where traits arose, and to make biological comparisons among genes, populations, and species. They can also be used to reconstruct ancestral traits and to estimate the timing of evolutionary events.
learning outcomes
You should be able to:
Use a phylogenetic tree to formulate a hypothesis about the origins of an epidemic.
Calculate the rate of a molecular clock from a graph that shows change over time.
Question 1
West Nile virus kills birds of many species and can cause fatal encephalitis (inflammation of the brain) in humans and horses. In the 1930s the virus was first isolated in Africa, where it is thought to be endemic. By the 1990s it had been found throughout much of Eurasia. West Nile virus was not found in North America until 1999, when it was first detected in New York, but since that time it has spread rapidly across most of the United States. Use the phylogenetic tree of West Nile virus isolates shown below to construct a hypothesis about the origin of the virus lineage that was introduced into the United States. The isolates are identified by their place and date of isolation.
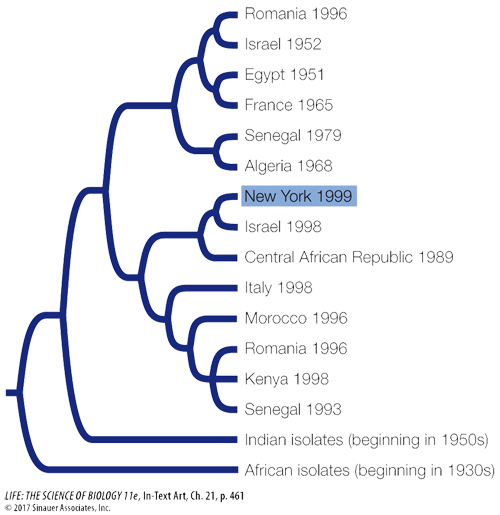
The West Nile Virus in the United States appears to be most closely related to a strain of the virus isolated in Israel. A reasonable hypothesis is that the virus emerged in Africa in the 1930s and subsequently moved into Asia and Europe, probably multiple times. In the late 1990s, a strain of the virus from Israel appears to have been transported to New York, perhaps carried by mosquitoes on an airplane or in a cargo shipment. Once in the United States, the virus spread quickly in native bird populations across North America.
Question 2
Researchers examined the molecular divergence of a mitochondrial DNA gene (cyt b) among sister species of birds called honeycreepers on different Hawaiian Islands. They then plotted the measured molecular divergence against the estimated dates for separation of the islands (see below). Calculate the average rate of change in cyt b (the molecular clock) from the graph.
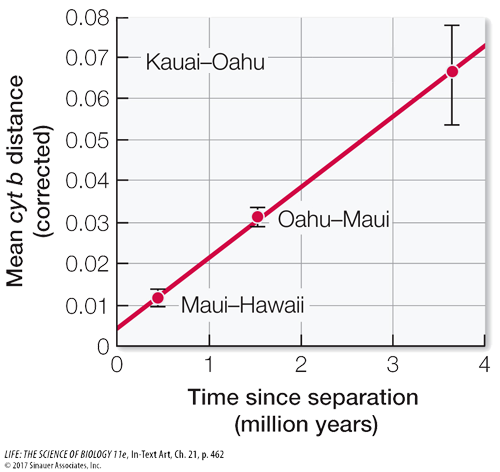
The rate of divergence is represented by the slope of the regression line. Since the regression line goes approximately through the origin (0, 0), the slope is approximately 7.5% change in cyt b per 4 my, or 1.875% change per million years.
All of life is connected through evolutionary history, and the relationships among organisms provide a natural basis for making biological comparisons. For these reasons, biologists use phylogenetic relationships as the basis for organizing life into a coherent classification system.