key concept 21.1 All of Life Is Connected through Its Evolutionary History
449
The sequencing of complete genomes from many diverse species has confirmed what biologists have long suspected: all of life is related through a common ancestor. The common ancestry of life explains why the general principles of biology apply to all organisms. Thus we can learn much about how the human genome works by studying the biology of model organisms because we share a common evolutionary history with those organisms. The evolutionary history of these relationships is known as phylogeny, and a phylogenetic tree is a diagrammatic reconstruction of that history.
focus your learning
Phylogenetic trees represent evolutionary relationships.
Phylogenies enable biologists to compare organisms and make predictions and inferences based on similarities and differences in traits.
Only homologous traits are used in reconstructing phylogenetic trees.
Phylogenetic trees are commonly used to depict the evolutionary history of species, populations, and genes. For many years such trees have been constructed based on physical structures, behaviors, and biochemical attributes. Now, as genomes are sequenced for more and more organisms, biologists are able to reconstruct the history of life in ever greater detail.
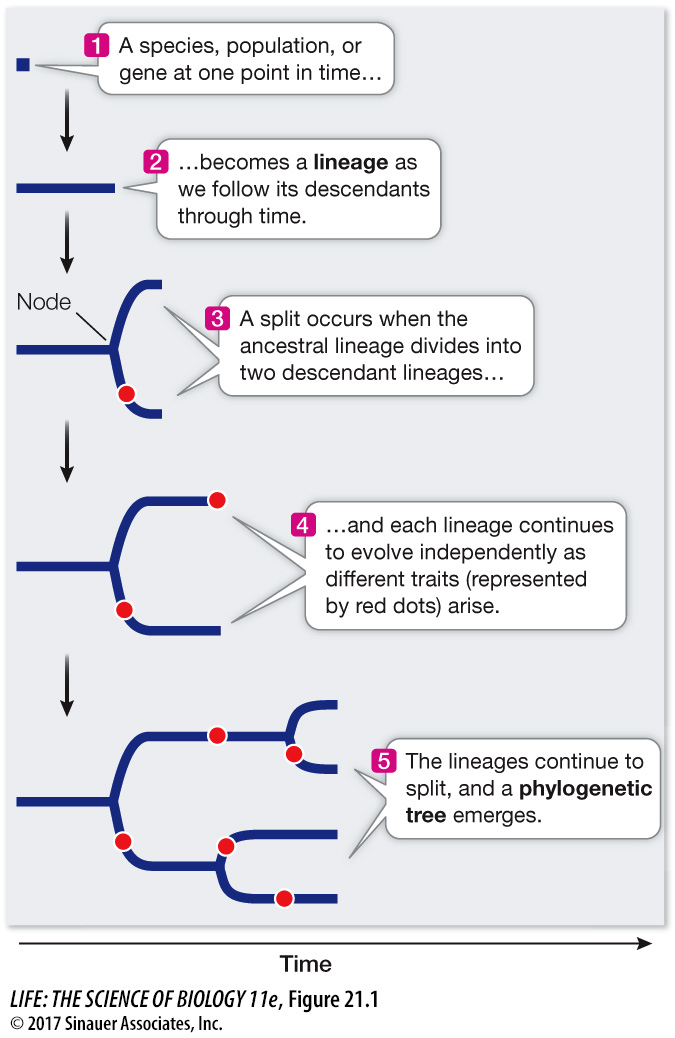
In Chapter 20 we discussed why we expect populations of organisms to evolve over time. We call a series of ancestor and descendant populations a lineage, which we can depict as a line drawn on a time axis, as shown in Figure 21.1. What happens when a single lineage divides into two? For example, a geographic barrier may divide an ancestral population into two descendant populations that no longer interbreed with one another. We depict such an event as a split, or node, in a phylogenetic tree (see Figure 21.1). Each of the descendant populations gives rise to a new lineage, and as these independent lineages evolve, new traits arise in each. As the lineages continue to split over time, this history can be represented in the form of a branching tree that can be used to trace the evolutionary relationships from the ancient common ancestor of a group of species, through the various lineage splits, up to the present populations of the organisms.
A phylogenetic tree may portray the evolutionary history of all life forms. Phylogenetic trees can also depict the history of a major evolutionary group (such as the insects) or of a much smaller group of closely related species. In some cases, phylogenetic trees are used to show the history of individuals, populations, or genes within a species. The common ancestor of all the organisms in the tree forms the root of the tree.
The depictions of phylogenetic trees in this book are rooted at the left, with time flowing from left (earliest) to right (most recent) (Focus: Key Figure 21.2A). The timing of splitting events in lineages is shown by the position of nodes on a time axis. These splits represent events where one lineage diverged into two, such as a speciation event (for a tree of species), a gene duplication event (for a tree of genes), or a transmission event (for a tree of viral lineages transmitted through a host population). The time axis may have an explicit scale, or it may simply show the relative timing of divergence events.
focus: key figure
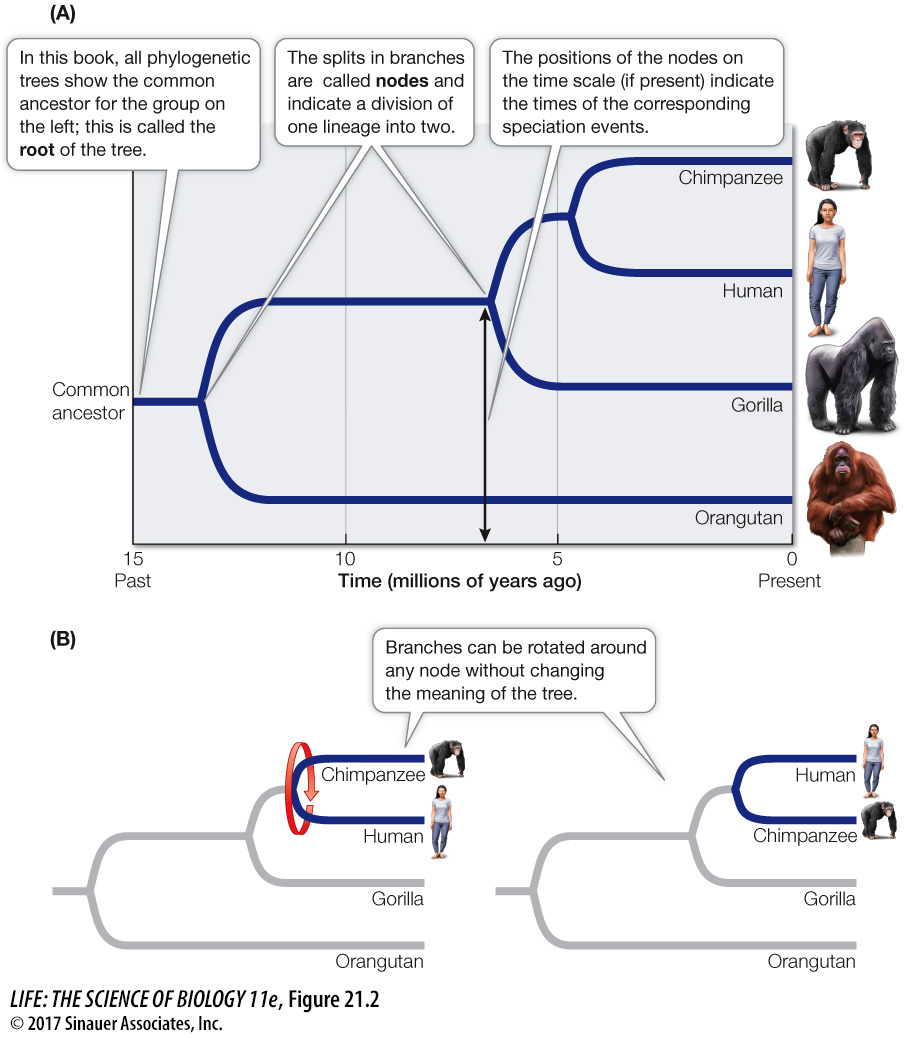
In this book’s illustrations, the order in which nodes are placed along the horizontal (time) axis has meaning, but the vertical distance between the branches does not. Vertical distances have been adjusted for legibility and clarity of presentation; they do not correlate with the degree of similarity or difference among groups. Note too that lineages can be rotated around nodes in the tree, so the vertical order of lineages is also largely arbitrary (Focus: Key Figure 21.2B). The important information in the tree is the branching order along the time axis, as this indicates when the various lineages last shared a common ancestor.
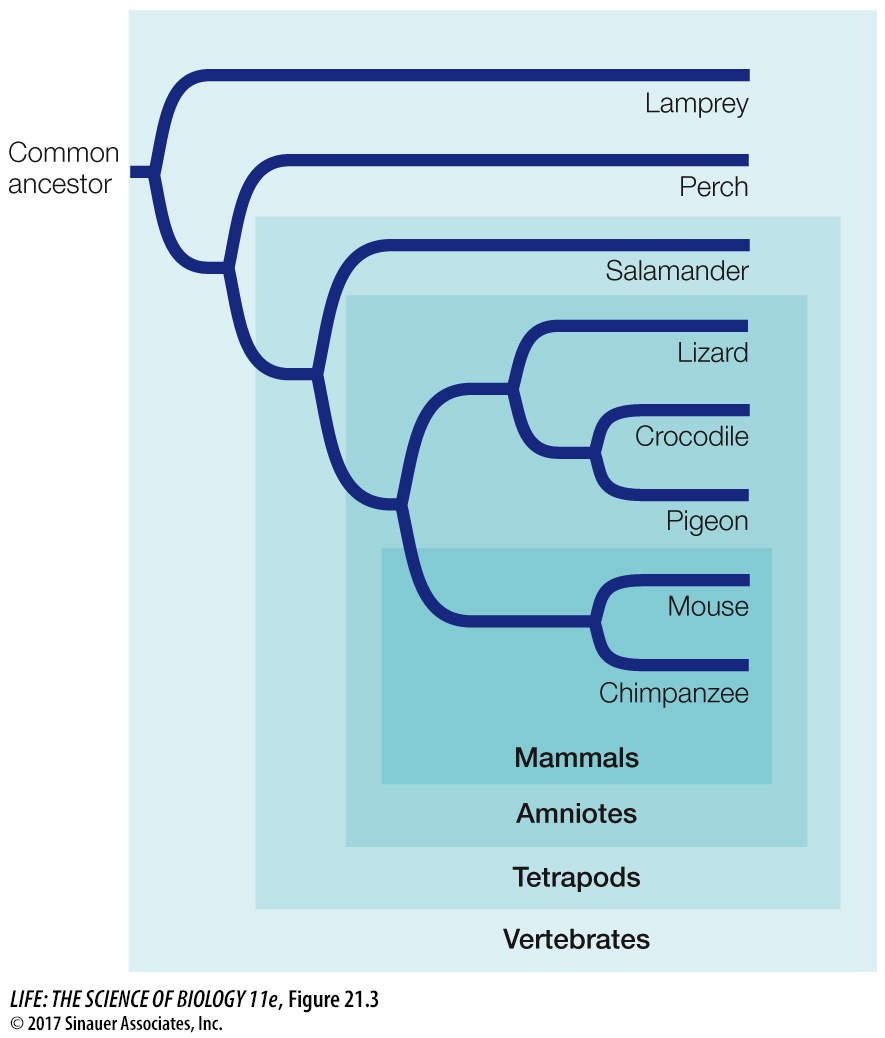
Any group of species that we designate with a name is a taxon (plural taxa). Examples of familiar taxa include humans, primates, mammals, and vertebrates; in this series, each taxon is also a member of the next, more inclusive taxon. Any taxon that consists of all the evolutionary descendants of a common ancestor is called a clade. Clades can be identified by picking any point on a phylogenetic tree and from that point tracing all the descendant lineages to the tips of the terminal branches (Figure 21.3). Two species that are each other’s closest relatives are called sister species. Similarly, any two clades that are each other’s closest relatives are sister clades.
450
Before the 1980s, phylogenetic trees tended to be seen only in the literature on evolutionary biology, especially in the area of systematics—the study and classification of biodiversity. But almost every journal in the life sciences published during the last few years contains phylogenetic trees. Trees are widely used in molecular biology, biomedicine, physiology, behavior, ecology, and virtually all other fields of biology. Why have phylogenetic studies become so widespread?