recap
22.3 recap
Allopatric speciation results from the separation of populations by geographic barriers; it is the dominant mode of speciation among most groups of organisms. Sympatric speciation may result from disruptive selection that results in ecological isolation, but polyploidy is the most common cause of sympatric speciation among plants.
learning outcomes
You should be able to:
Contrast the steps involved in different modes of speciation.
Make inferences based on an understanding of the process of allotropic speciation.
Diagram the relationship between geographic isolation and speciation and interpret the data to make and support predictions.
Question 1
Explain how speciation via polyploidy can happen in only two generations.
Polyploids (e.g., tetraploids) can be produced in the first generation. Hybrids between diploids and tetraploids may be produced in the second generation, forming triploid individuals, but meiosis in the triploids results in gametes with unbalanced chromosome numbers, which results in sterile offspring. An F1 tetraploid is able to self-
Question 2
If allopatric speciation is the most prevalent mode of speciation, what do you predict about the geographic distributions of many closely related species? Does your answer differ for species that are sedentary versus highly mobile?
476
Species that arise in allopatry initially occur in separate, but usually adjacent, ranges (e.g., see Figure 17.6). Therefore, we would expect many closely related species to exhibit this same pattern. The ranges of highly mobile species are more likely to change over time, so the pattern should be strongest among relatively sedentary species. Biologists have confirmed these predictions across many diverse groups of organisms.
Question 3
The species of Darwin’s finches shown in the phylogeny in Figure 22.8 have all evolved on islands of the Galápagos archipelago within the past 3 million years. Molecular clock analysis (see Key Concept 21.3) has been used to determine the dates of the various speciation events in that phylogeny. Geological techniques for dating rock samples (see Key Concept 24.1) have been used to determine the ages of the various Galápagos islands. The table shows the number of species of Darwin’s finches and the number of islands that have existed in the archipelago at several times during the past 4 million years.
| Time (mya) | Number of islands | Number of finch species |
|---|---|---|
| 0.25 | 18 | 14 |
| 0.50 | 18 | 9 |
| 0.75 | 9 | 7 |
| 1.00 | 6 | 5 |
| 2.00 | 4 | 3 |
| 3.00 | 4 | 1 |
| 4.00 | 3 | 0 |
Plot the number of species of Darwin’s finches and the number of islands in the Galápagos archipelago (dependent variables) against time (independent variable).
Are the data consistent with the hypothesis that isolation of populations on newly formed islands is related to speciation in this group of birds? Why or why not?
If no more islands form in the Galápagos archipelago, do you think that speciation by geographic isolation will continue to occur among Darwin’s finches? Why or why not? What additional data could you collect to test your hypothesis (without waiting to see if speciation occurs)?
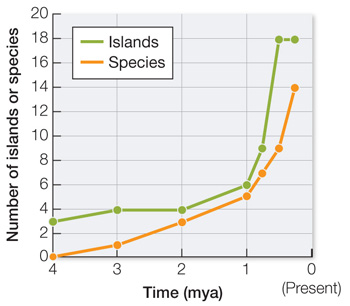
- Yes, because the curve for the number of species lags behind the curve for the number of islands; but the two curves exhibit very similar changes in slope through time. As new islands arise, new opportunities for speciation also arise. The number of species at any one time is always just below the number of distinct islands.
- There are currently 18 islands in the archipelago and only 14 species (as recognized by some biologists). This suggests that there are still opportunities for additional speciation by geographic isolation. Based on our graph from question 3a, we expect populations of species that occur on two or more islands to diverge into distinct species over time. To test this hypothesis, we could collect samples of each population and examine genetic divergence between the samples. Significant genetic divergence between the populations on different islands suggests that the distance between the islands is a significant barrier to gene flow, so the populations are expected to diverge into distinct species over time (see Key Concept 22.2). Indeed, as we noted in the text discussing Darwin’s finches, some biologists recognize the genetically divergent (but morphologically similar) species on different islands as distinct species, which is why they recognize as many as 18 different species of Darwin’s finches.)