Models of sequence evolution are used to calculate evolutionary divergence
The sequence comparison procedure illustrated in Figure 23.1 gives a simple count of the number of similarities and differences between the proteins of two species. In the context of two aligned DNA sequences, we can count the number of differences at homologous nucleotide positions, and this count indicates the minimum number of nucleotide changes that must have occurred since the two sequences diverged from a common ancestral sequence.
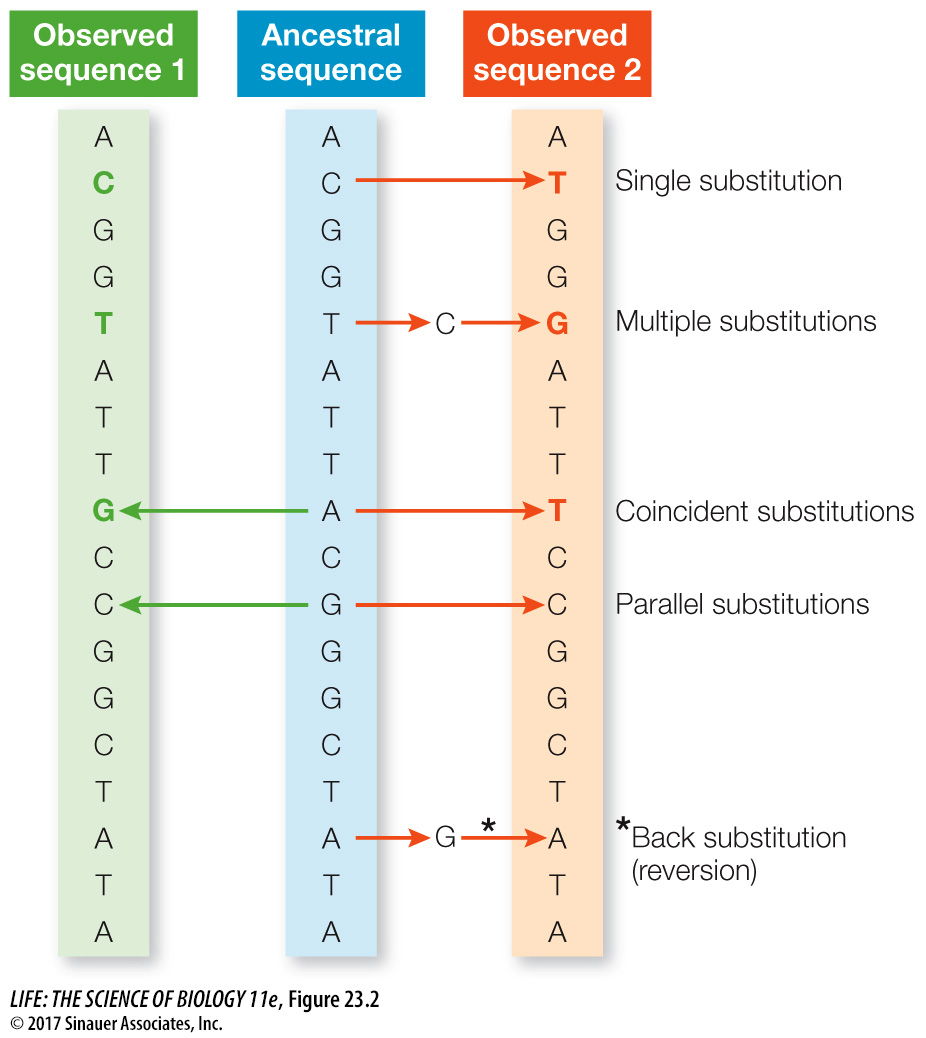
Although it is useful in determining a minimum number of changes between two DNA sequences, the count provided by sequence alignment almost certainly underestimates the actual number of changes that have occurred since the sequences diverged. Any given change counted in a similarity matrix of DNA sequences may result from multiple substitution events that occurred at a given nucleotide position over time. As illustrated in Figure 23.2, any of the following events may have occurred at a given nucleotide position that would not be revealed by a simple count of similarities and differences between two DNA sequences:
Multiple substitutions. More than one change has occurred at a given position between the ancestral sequence and at least one of the observed sequences.
Coincident substitutions. At a given position, different substitutions have occurred between the ancestral sequence and each observed sequence.
Parallel substitutions. The same substitution has occurred independently between the ancestral sequence and each observed sequence.
Back substitutions (also called reversions). In a variation on multiple substitutions, after a change at a given position, a subsequent substitution has changed the position back to the ancestral state.
489
To correct for undercounting of substitutions, molecular evolutionists have developed mathematical models that describe how DNA (and protein) sequences evolve. These models take into account the relative rates of change from one nucleotide to another. For example, transitions (changes between the two purines, A ↔ G, or between the pyrimidines, C ↔ T) are typically more frequent than transversions (a purine is replaced by a pyrimidine, or vice versa). These models also include parameters such as the different rates of substitution across different parts of a gene and the proportions of each nucleotide present in a given sequence. Once such parameters have been estimated, the model is used to correct for multiple substitutions, coincident substitutions, parallel substitutions, and back substitutions. The revised estimate accounts for the total number of substitutions likely to have occurred between two sequences, which is almost always greater than the observed number of differences.
As sequence information becomes available for more and more genes in an ever-
Media Clip 23.1 The Ubiquitous Protein
www.life11e.com/