Extinction happens continuously, but mass extinctions result from sudden environmental changes
The physical and biological components of Earth’s environment are constantly changing. As we saw in Chapter 23, new species are constantly being generated. At the same time, some species decline to the point that they can no longer maintain viable populations and go extinct. Both speciation and extinction have been occurring throughout the history of life. Why do species go extinct? Short-
As population sizes decrease, the probability of extinction accelerates. At any population size, there is variation in reproductive success, and a particular individual may fail to reproduce successfully. When population sizes are very small, such variation has a bigger influence. Low reproduction by a few individuals in a small population is likely to lead to loss of the population. The smaller the population, the larger the role that chance plays. Variation in reproductive rates is less likely to lead to extinction in large populations, where chance effects play a much smaller role.
Smaller populations can also have density-
An experiment on sea palms (a species of kelp) illustrates the relative influence of various factors on extinction probability as it relates to population size (Figure 24.10). Biologists experimentally established isolated populations of sea palms on intertidal rocky shores and examined their survivorship through time. At small population sizes, random demographic factors were most likely to lead to local extinction, whereas environmental fluctuations were much more likely to cause the extinction of larger populations.
517
experiment
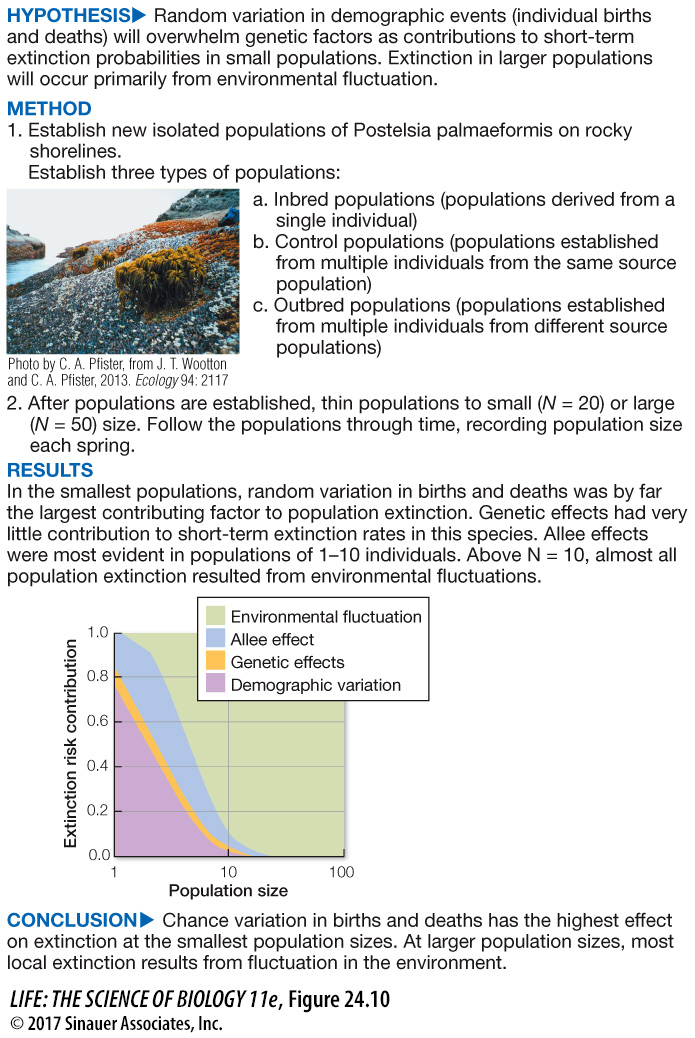
Figure 24.10A What Factors Influence Extinction in Small Populations?
Original Paper: Wootton, J. T. and C. A. Pfister. 2013. Experimental separation of genetic and demographic factors on extinction risk in wild populations. Ecology 94: 2117–
J. Timothy Wootton and Catherine Pfister established new, isolated populations of sea palms (a species of kelp, Postelsia palmaeformis) on exposed rocky shores of the northwestern United States. They then studied the probability of population extinct as a function of genetic structure and population size.
work with the data
Figure 24.10B What Factors Influence Extinction in Small Populations?
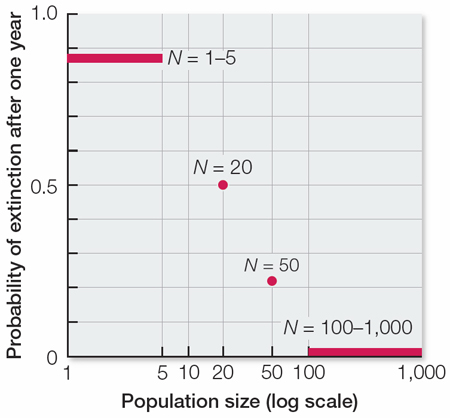
After establishing the experimental populations, the researchers counted the number of individuals present in each population each spring. They then recorded which populations were extant (still existing) or extinct in the following year. The table shows data for a few of the population sizes they examined:
| Population size in previous year | Number of populations extant in following year | Number of populations extinct in following year |
|---|---|---|
|
1– |
2 | 13 |
| 20 | 13 | 13 |
| 50 | 19 | 5 |
| 100– |
24 | 0 |
QUESTIONS
Question 1
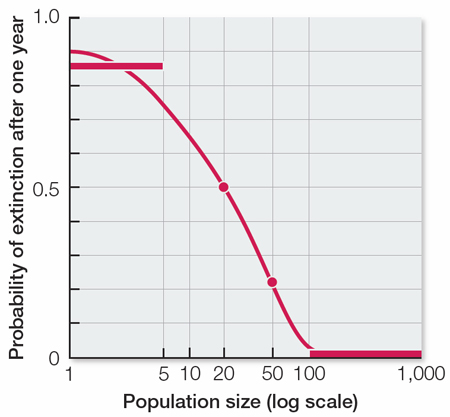
Draw a graph showing probability of extinction (y axis) as a function of population size (x axis) based on the data presented above. Use a log scale for the x axis. Draw a curve to approximate the relationship between probability of extinction and population size.
First, plot the data from the table:
Then approximate an extinction curve from the plotted points.
Question 2
The graph you produced in Question 1 shows the extinction probability of a population after 1 year. If you started a population with 20 individuals, how likely do you think it would be to survive for 2 years? What additional data could you collect after 1 year to help answer this question?
The survivorship after 2 years would clearly be lower than after 1 year. After 1 year, about half the populations of size 20 would go extinct. To calculate the number that would go extinct after 2 years, you would need to know the distribution of population sizes among the half of the populations that did not go extinct in the first year. If we assume that the average size of the surviving populations was still 20 after 1 year, then we would expect another half of the remaining populations to go extinct in the second year (for a 2-
A similar work with the data exercise may be assigned in LaunchPad.
The five mass extinction events shown in Figure 24.2 are notable because they suddenly increased the extinction rate and affected a large percentage of living organisms at the same time. In each case, rapid and extreme environmental changes caused many species to go extinct simultaneously.