Fungi are used as model organisms in laboratory studies
Much of what we know about many basic aspects of cell and molecular biology comes from the study of model organisms. Among the eukaryotes, some fungi have numerous advantages over model plant and animal systems for laboratory investigations.
Of particular importance as model organisms are several species of sac fungi: Aspergillus nidulans (a brown mold), Neurospora crassa (a red bread mold), Saccharomyces cerevisiae (baker’s, or brewer’s, yeast), and Schizosaccharomyces pombe (fission yeast). These species can be cultured in large numbers in small spaces, and they have short generation times, so that genetic investigations can be conducted in days rather than years. Furthermore, their genomes are relatively small and encode relatively few genes compared with those of most plants and animals, so it is easier to elucidate the functions of the fungal genes responsible for basic biological functions.
631
investigating life
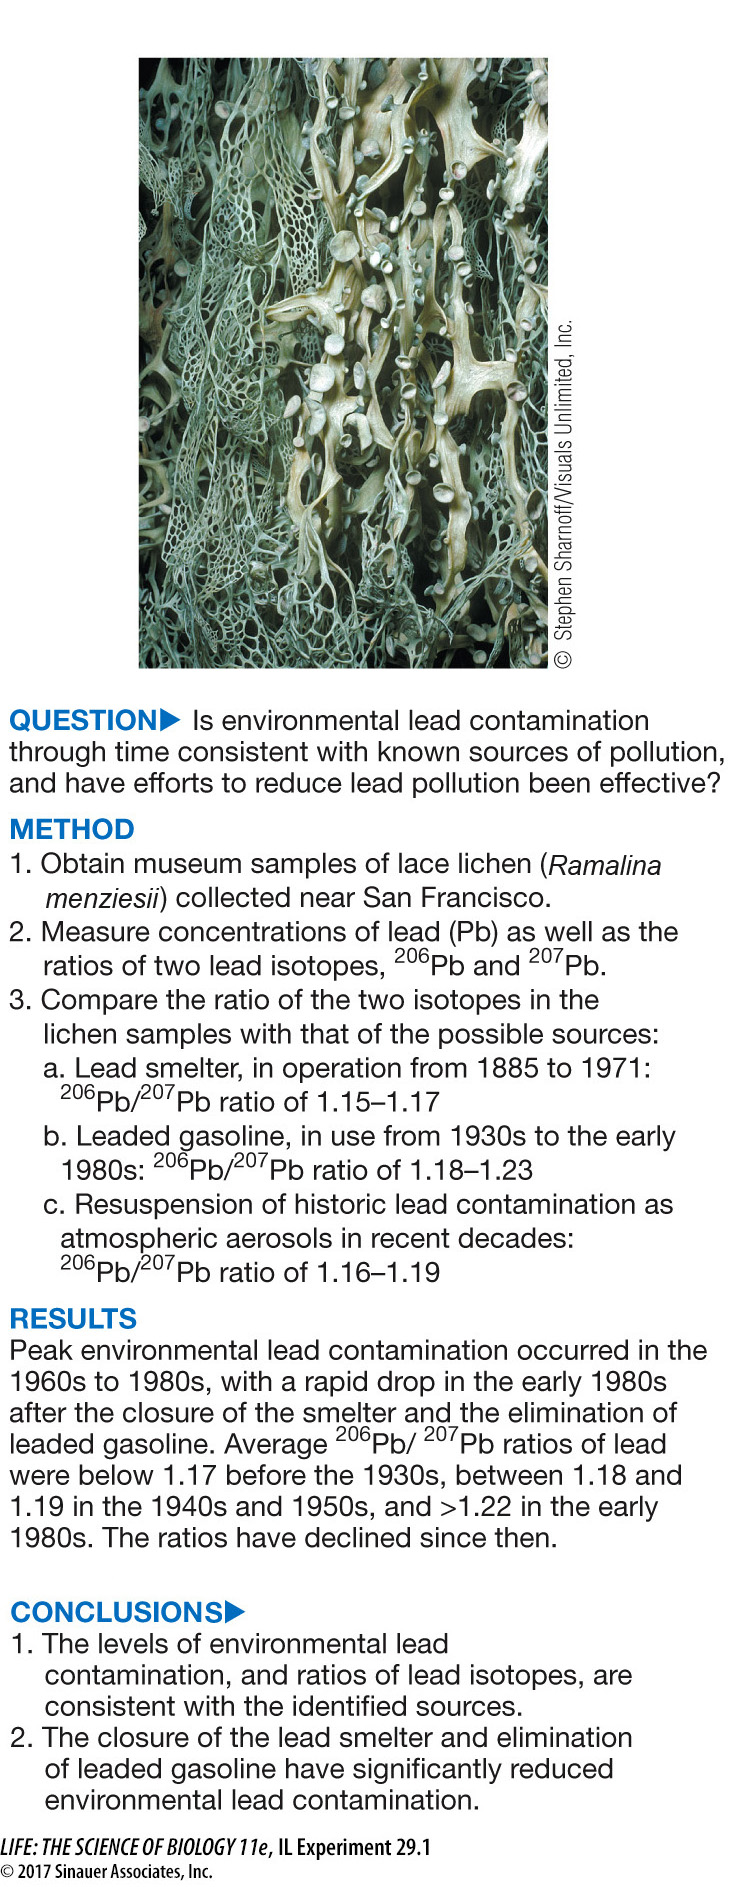
Using Fungi to Study Environmental Contamination
experiment
Original Paper: Flegal, A. R., C. Gallon, S. Hibdon, Z. E. Kuspa and L. F. Laporte. 2010. Declining—
A. Russell Flegal and his colleagues analyzed museum samples of lace lichens (Ramalina menziesii) collected between 1892 and 2006 near San Francisco, California. Their goals were to determine the sources of lead contamination and to evaluate the effectiveness of efforts to reduce this contamination.
work with the data
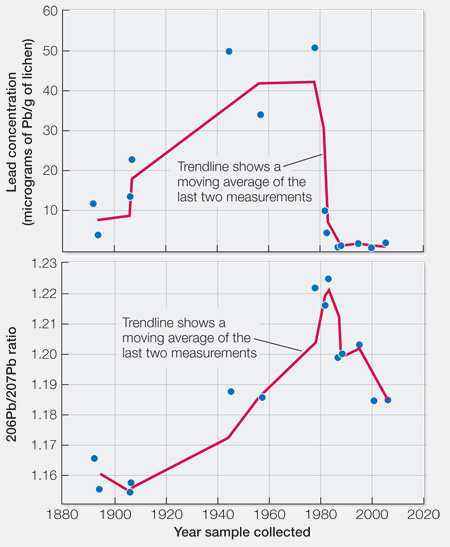
From the data below, plot lead concentration in the lichen samples against year of sample collection. Make a second plot, this one of 206Pb/207Pb ratio against year of sample collection.
| Sample | Year collected |
Lead concentration (µg of Pb/g lichen) |
206Pb/207Pb ratio |
|---|---|---|---|
| 1 | 1892 | 11.9 | 1.165 |
| 2 | 1894 | 4.0 | 1.155 |
| 3 | 1906 | 13.7 | 1.154 |
| 4 | 1907 | 22.9 | 1.157 |
| 5 | 1945 | 49.9 | 1.187 |
| 6 | 1957 | 34.2 | 1.185 |
| 7 | 1978 | 50.9 | 1.221 |
| 8 | 1982 | 10.0 | 1.215 |
| 9 | 1983 | 4.6 | 1.224 |
| 10 | 1987 | 1.0 | 1.198 |
| 11 | 1988 | 1.3 | 1.199 |
| 12 | 1995 | 1.9 | 1.202 |
| 13 | 2000 | 0.4 | 1.184 |
| 14 | 2006 | 1.8 | 1.184 |
QUESTIONS
Question 1
Calculate trend lines for your plots by plotting the average for the each adjacent pair of observations, from 1894 to 2006. (In other words, plot the average for sample 1 and 2, then the average for sample 2 and 3, and so on, to produce a trend line for the data.)
Question 2
Do your analyses support the conclusions of the study? How do you think you could improve the analysis?
Yes, the levels of environmental lead contamination and the ratios of lead isotopes are consistent with the identified sources. The closure of the lead smelter was offset by the use of leaded gasoline, but there was a marked drop-
A similar work with the data exercise may be assigned in LaunchPad.