Life history strategies can vary at species and population levels
Life history strategies can vary among species, even for species that are taxonomically closely related, as a consequence of environmental differences. For example, on Mount Kenya two species of unusual plants in the genus Lobelia live in different types of habitats (Figure 54.11). One species, Lobelia telekii, lives on the dry rocky slopes of the mountain, where it reproduces only once (a strategy called semelparity), produces vast numbers of small seeds, and has a short life span. In the moist valley bottoms, another species, Lobelia keniensis, reproduces more than once (a strategy called iteroparity), produces fewer but larger seeds per reproductive event, and lives longer. Semelparity is typical of organisms whose probability of dying remains high even when they reach adulthood; it is seen in some fish, many insects, and all annual plants. In contrast, iteroparity is typical of organisms with long life spans. For example, because environmental conditions within the nests of social insects such as honey bees and ants are remarkably stable, iteroparity is the rule among these species; some queens live 10 years or longer and reproduce over their entire adult lives.
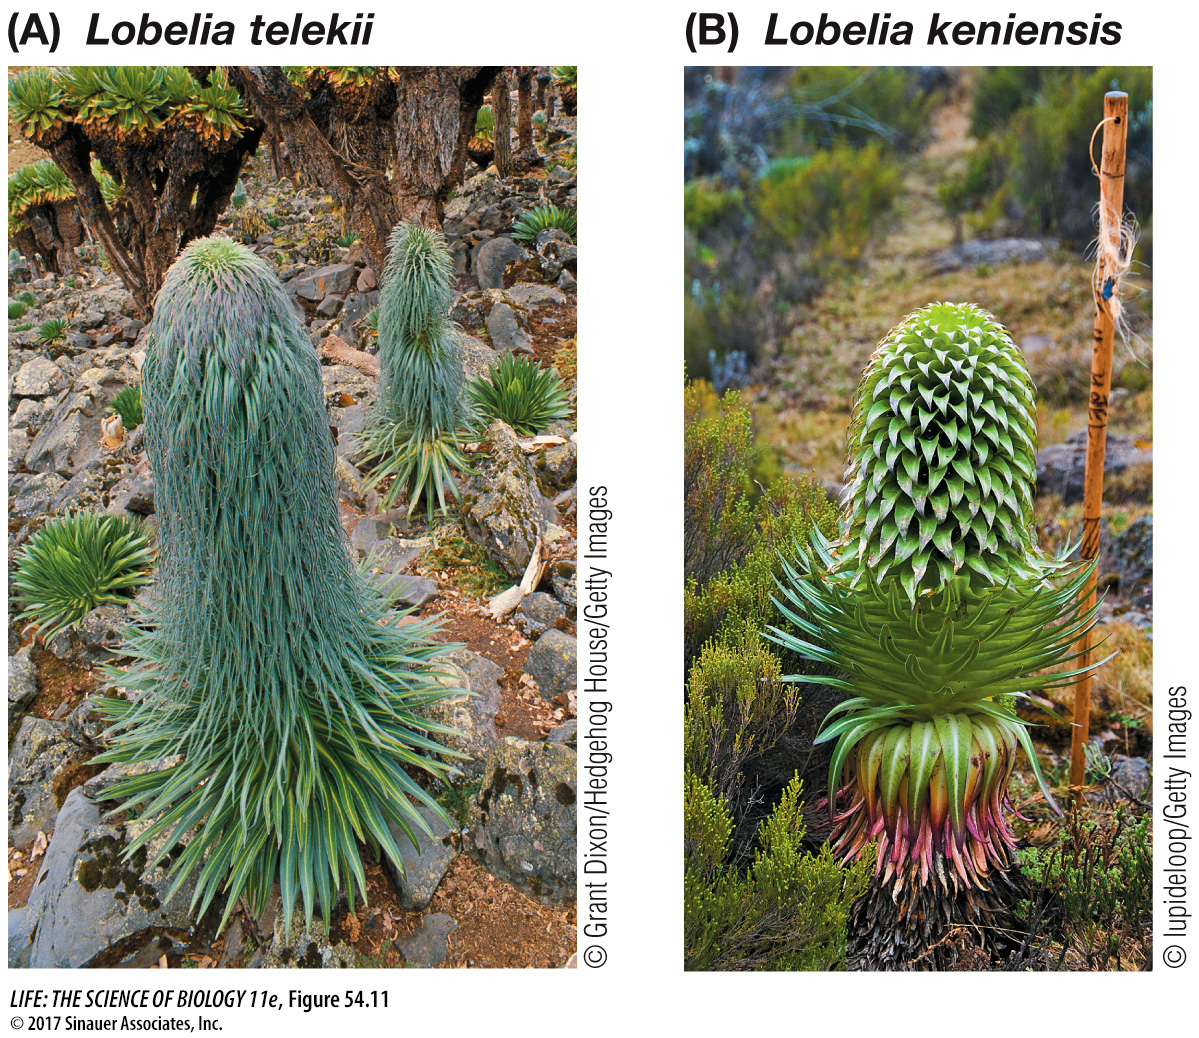
Figure 54.11 Related Species with Vastly Different Life History Strategies On Mount Kenya, Africa, (A) Lobelia telekii lives on the dry rocky slopes of the mountain, where it reproduces once (is semelparous), produces many seeds, and has a short life span. In the moist valley bottoms, (B) Lobelia keniensis reproduces multiple times (is iteroparous), produces fewer but larger seeds, and lives longer.
Life history strategies can also vary within species at the population level. For example, some populations of guppies (Poecilia reticulata) in Trinidad live in streams where they are attacked and eaten by larger fish (Figure 54.12). But some streams have waterfalls that predatory fish are unable to negotiate. Guppies that live in the predator-free areas upstream from those waterfalls have lower death rates compared with guppies below the falls. To see whether the risk of being eaten by a predator influenced the life history strategies of these guppies, David Reznick and his colleagues collected guppies from high-predation and low-predation sites and raised them in the laboratory. Some guppies from each group were provided with plentiful food, and others with limited food, to simulate the variation the fish would typically encounter in their home streams. In the laboratory, where no predators were present, guppies from high-predation sites matured earlier, reproduced more frequently, and produced more offspring in each brood than did guppies from low-predation sites, no matter how much food the guppies received. The investigators concluded that predation had genetically selected for early and frequent reproduction in the guppies living below the falls.

Figure 54.12 Predation Affects the Life History of Guppies In Trinidad, populations of guppies (Poecilia reticulata) from high-predation stream sites below the falls matured earlier, reproduced more frequently, and produced more offspring per brood compared with guppies from low-predation stream sites above the falls, no matter how many resources the guppies were given.
Question
Q: Are the life history strategies of the two guppy populations, either from high-predation streams and low-predation streams, likely genetically determined? Why?
Yes, the life history strategies of the guppy populations are likely genetically determined. When the two populations were provided with unlimited food and lacked exposure to predation, they did not change their strategies.
Perhaps the best-studied example of how life history traits can vary not only among populations, but also among individuals, is the case of human life span. Human life span varies widely around the world and between the sexes (Figure 54.13). Today, humans live on average to 87 years in Japan, Hong Kong, and many European countries, and to 35–50 years in some African countries (e.g., Sierra Leone, Democratic Republic of the Congo, and Somalia) where HIV infection, famine, and war are common. In the United States, average life span is 80 years, with women outliving men by 5 years. Research has shown that the factors contributing to lower life expectancy rates in men include higher rates of homicide, accidental death, and parasitic and infectious diseases.
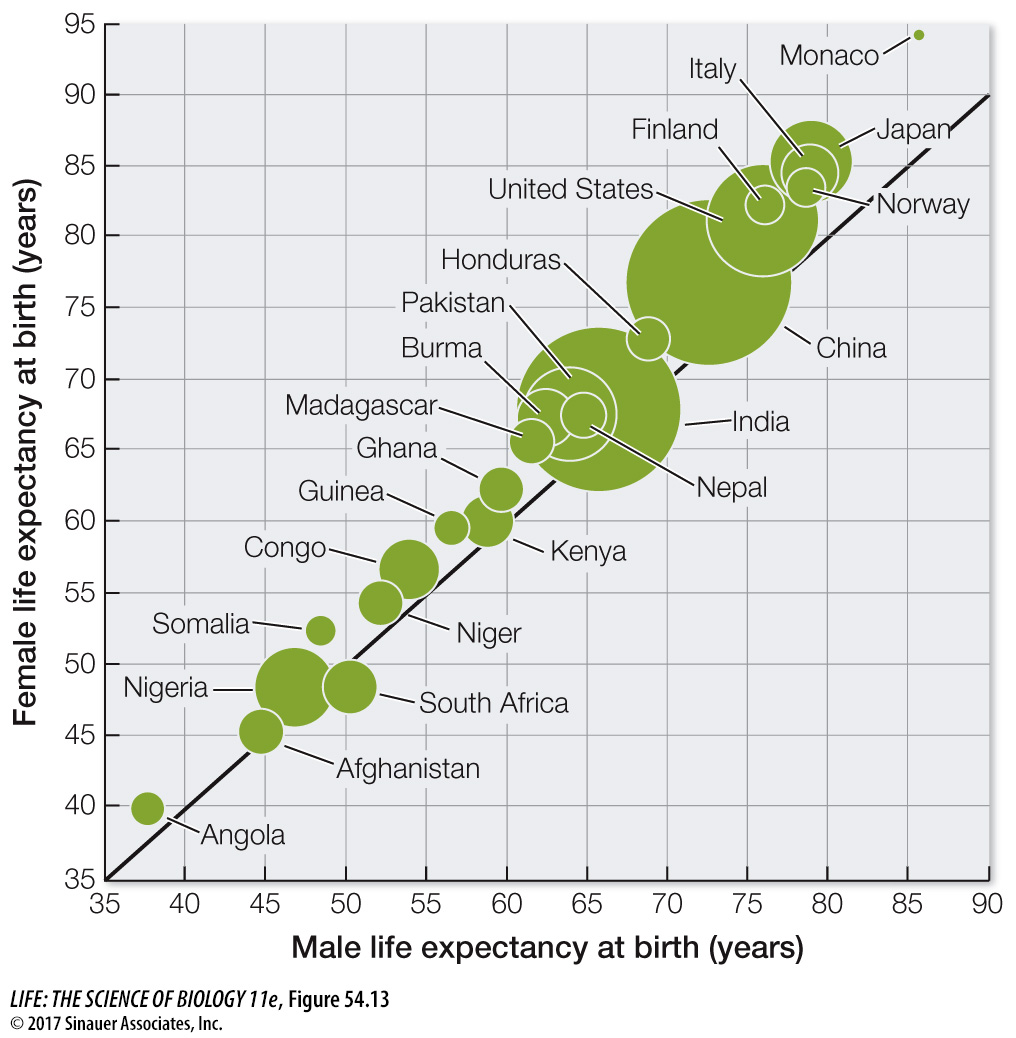
Figure 54.13 Human Life Expectancy around the World Comparison of male and female life expectancy at birth for a variety of countries in 2016. The solid black line corresponds to equal female and male life expectancy. The sizes of the bubbles are linearly proportional to the population of the country.
For the most part, the large variability in life span we see in humans can be attributed to environmental factors. If you lived during the Bronze Age, your life expectancy was 28 years, and it was not much better even in the early nineteenth century (about 35 years). Reduction in infant mortality has accounted for most of the increase in life expectancy, but since the end of the 1950s the mortality rate of those older than 80 years has decreased by 1.5 percent each year. Much of the increase in life expectancy that we enjoy today is the result of modern advances in human health and nutrition, which begs the question: Is there a limit to human life expectancy? One study, which plotted human life-span data over time, shows a remarkable linear relationship with no leveling off yet, that might indicate an upper limit (Figure 54.14). In fact, because life span has increased by 2.5 years every decade for the last 150 years, one possible scenario is that 60 years from now the average person’s life span will reach 100 years! While some limit on human lifespan is mostly certain, these predictions suggest that human life expectancy is a highly flexible life history trait indeed.
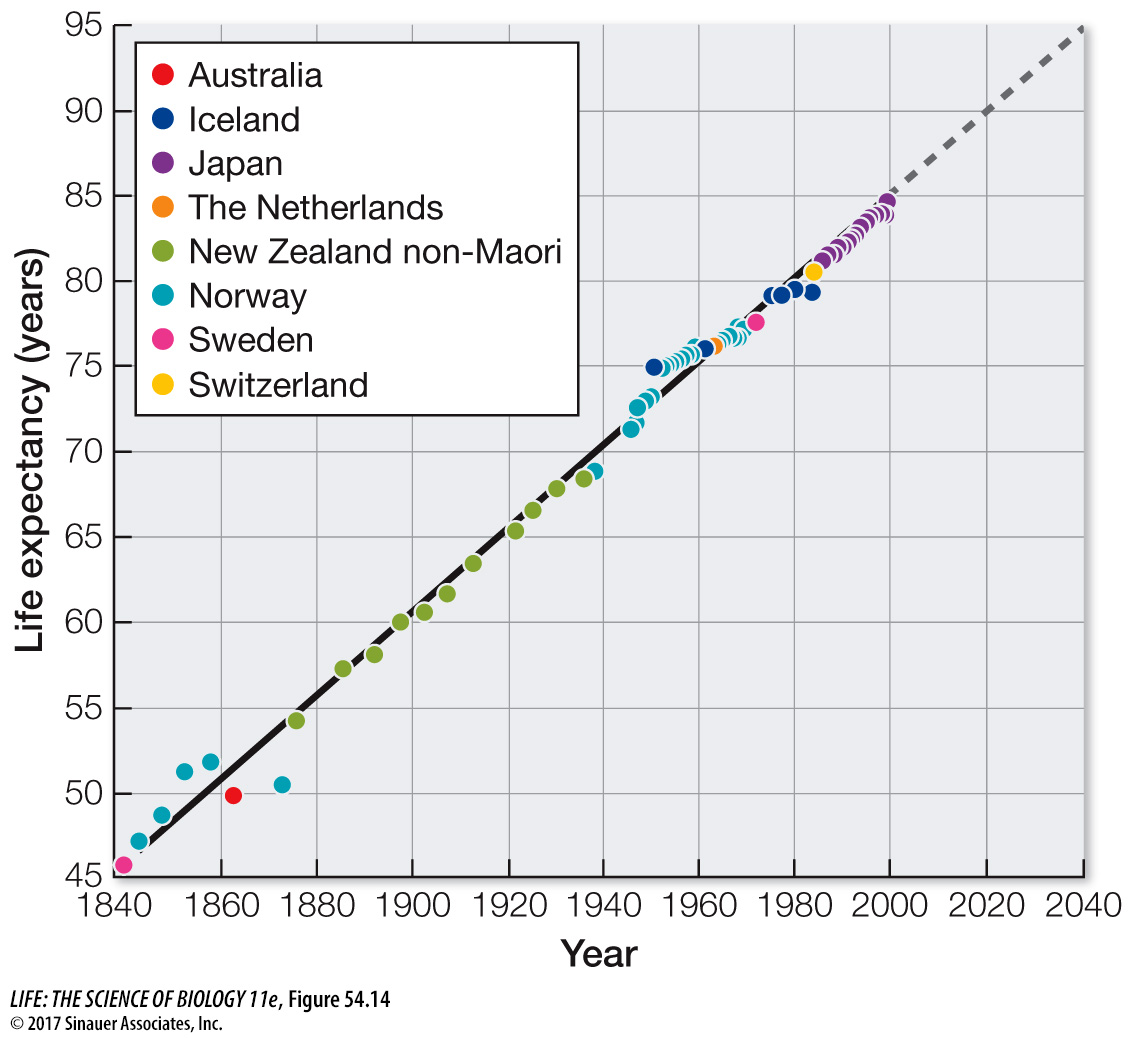
Figure 54.14 Human Life Expectancy—Past, Present, and Future Recorded human female life expectancy from 1840 to the present. The linear trend in life expectancy is depicted by the bold line, and the extrapolated trend by the dashed gray line. Based on the trend, in 2040 the average woman might have a life span of 95 years.
Question
Q: Compare the differences in female life expectancy between 1840–1940 and 1940–2040. Is the rate of change in life expectancy predicted to increase?
Yes, the rate of change is predicted to increase. From 1840 to 1940, female life expectancy increased by 25 years (from 45 years in 1840 to 70 years in 1940), thus the rate of change is 55% ((25/45) × 100%) over 100 years. From 1940 to 2040, female life expectancy is predicted to increase by 25 years (from 70 years in 1940 to 95 years in 2040), thus the rate of change is 36% ((25/70) × 100%) over 100 years. So over the same amount of time (100 years), life expectancy increased faster in the first time interval (1840-1940) than it is predicted to do in the second time interval (1940-2040).