Ecologists use a variety of approaches to estimate population size and extent
1170
Accurately measuring the size and extent of a population is harder than you might think. One challenge is determining the boundary of the population. If the area is self-
1171
As you might imagine, estimating population densities is easiest for sessile organisms. Investigators need only count the individuals in a sample of representative locations and extrapolate the counts to the entire geographic range of the population. Individuals may be counted within a measured area called a quadrat or along a transect—a line drawn across an area within the range of the population (often designated by a tape measure marked at regular intervals). By making repeated counts with either of these methods, investigators can use these surveys to make reasonably good estimates of the size of a population.
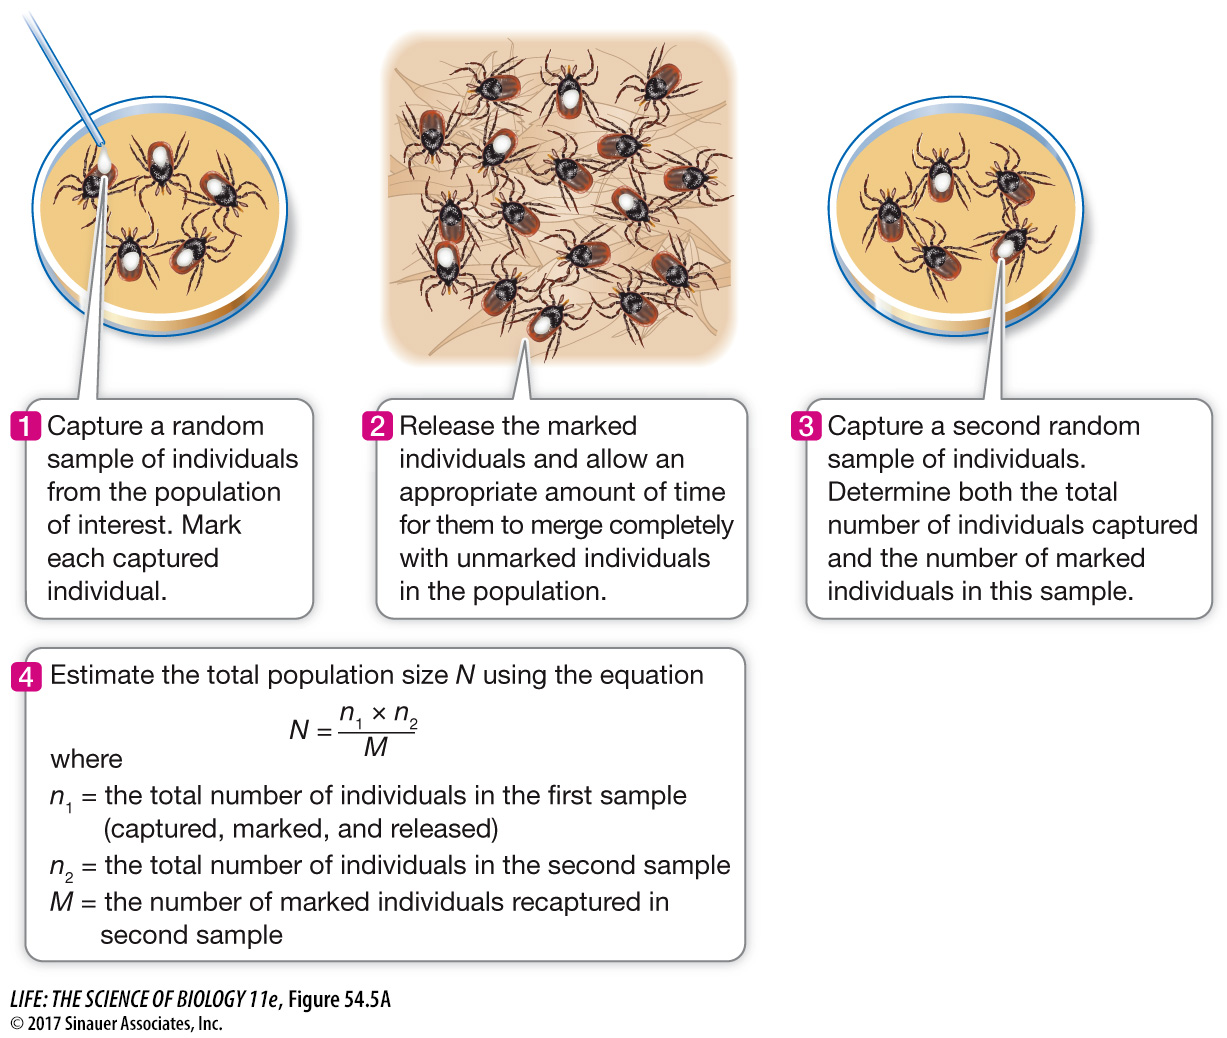
Counting mobile organisms is more difficult because individuals move into and out of sampling areas, as you saw in the humpback whale example. In such cases, investigators may use the mark–
research tools
Figure 54.5A The Mark–
Animation 54.1 The Mark—
www.life11e.com/
Figure 54.5B work with the data follows below.
work with the data
Figure 54.5B Monitoring Tick Populations
Original Paper: Falco, R. C. and O. Fish. 1988. Prevalence of Ixodes dammini near the homes of Lyme disease patients in Westchester County, New York. American Journal of Epidemiology 127: 826–
Lyme disease is a chronic and debilitating condition caused by spirochete bacteria of the genus Borrelia, which infect humans by way of the bite of an intermediate host, the black-
| Original capture event |
Second capture event (3 weeks later) |
|
|---|---|---|
| Adult ticks captured | 180 | 33 |
| No. of marked ticks | 180a | 8 |
aAll ticks captured in the first event were marked with acrylic paint and released.
QUESTIONS
Question 1
Refer to Figure 54.5A. Using the equation and other information described in that figure, estimate the total number of adult ticks in the sampled lawn from the data table above.
The equation in Figure 54.5A states that N = (n1 × n2)/M. In words, the estimated total number of ticks (population size N) equals the total number of individuals captured, marked, and released in the first sample (n1 = 180) times the total number of individuals captured in the second sample (n2 = 33) divided by the number of marked individuals recaptured in the second sample (M = 8). Thus N (estimated population of the sampled lawn) = (180 × 33)/8 = 5,940/8 = 742.5 adult ticks.
Question 2
The lawn was approximately 700 m2 in size. What is the approximate density of ticks per square meter?
Calculate this by dividing 742.5 (the estimated number of ticks in the lawn population, per Question 1) by 700 (number of m2) = approximately 1.06 ticks per square meter.
Question 3
What do you think might be the implications of this study for residents of this neighborhood?
This study was conducted in order to evaluate the risk that residents of this suburban neighborhood have of encountering the tick vectors of Lyme disease in their own yards; a high risk of encounter means that there is also likely to be a high risk of contracting the disease. A density of slightly more than one tick per square meter of lawn suggests that residents of this community are indeed likely to encounter ticks and, accordingly, have a high probability of contracting Lyme disease if they spend time outdoors on their lawns.
A similar work with the data exercise may be assigned in LaunchPad.
1172
More recently, ecologists have used DNA analysis to determine how many unique individuals might be contained within a population. In some cases, instead of capturing individuals and collecting DNA, ecologists collect the next best thing—