Invasive predators, competitors, and pathogens threaten many species
Deliberate or inadvertent introductions of non-native species have increased exponentially over the last 200 years. It is estimated that 50,000 species have been introduced to the United States alone. Many of these species were intentionally introduced to provide food, natural resources, or other important services for humans. But roughly 10 percent of these species have become invasive—that is, they reproduce rapidly, spread widely, and have mostly negative effects on the native species or ecosystems of the region. As you saw in Key Concept 56.2, once an introduced species arrives in a new community, a successful invasion usually involves multiple introduction events and the ability to cope with the physical environment and coexist with other species in the community.
While arguments can be made for the positive side of some species invasions, most invasions have had negative effects on species and ecosystems. For example, estimates suggest that 400 of the 958 species (42%) listed under the U.S. Endangered Species Act are at risk primarily because of predation, competition, or disease transmission by invasive species. Invasive species also can have dramatic effects on the functions and services of ecosystems, affecting fire cycles, water availability, and coastal sedimentation (Figure 58.10). Invasive species have even changed the genetic diversity of native species through hybridization events with wild populations (e.g., non-native rainbow trout and native cutthroat trout in Montana). The total cost estimate for dealing with undesirable invasive species in the United States alone was roughly $120 billion per year.
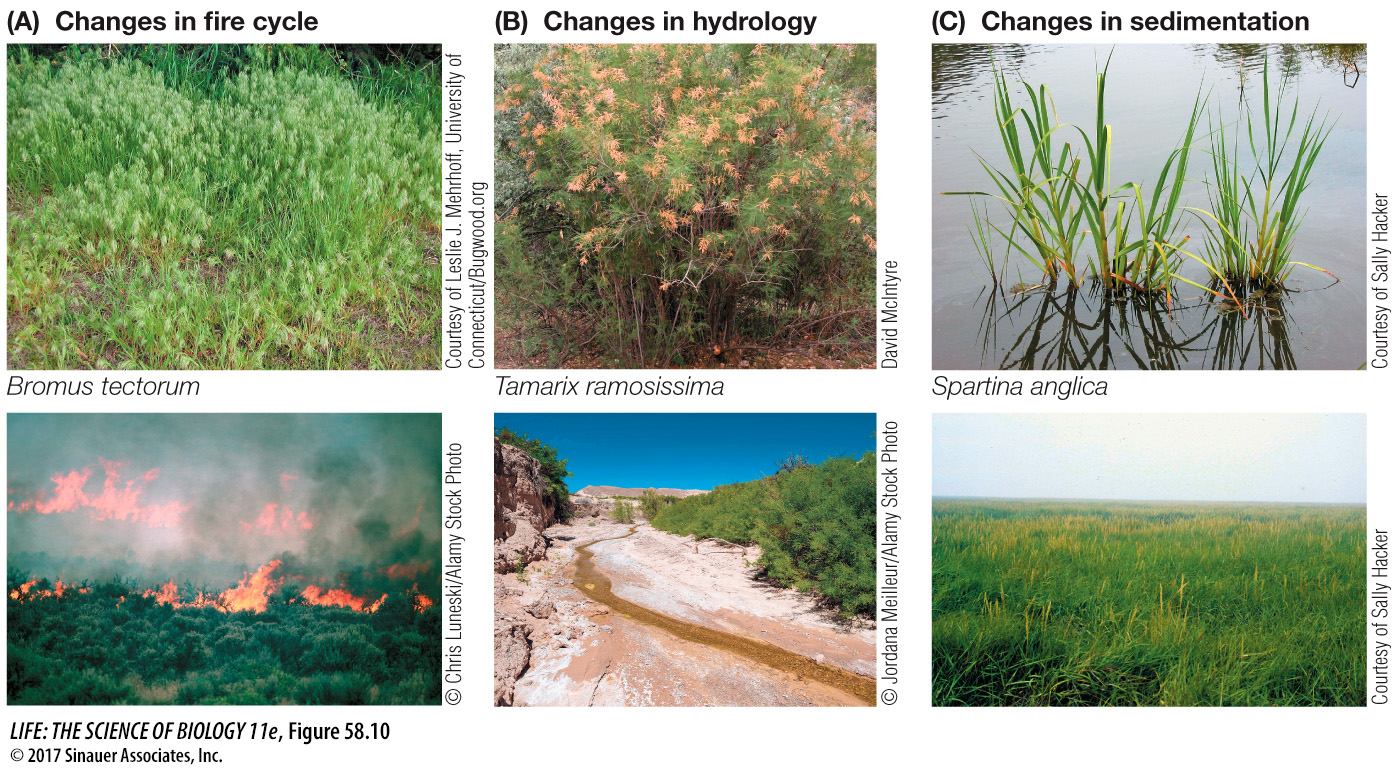
Figure 58.10 Species Invasions Can Change Ecosystem Functions and Services Three examples of the effects that invasive species can have: (A) cheatgrass increases the fire cycle in sagebrush habitat, (B) salt cedar draws down water in desert streams, and (C) English cordgrass leads to sedimentation, transforming coastal mudflats into salt marshes.
Non-native species are spread in a variety of ways. Over the past 400 years, Europeans colonizing new continents have deliberately introduced plants and animals to reconstruct their once familiar surroundings. Many of these introductions have had disastrous effects on native flora and fauna. In Australia the introduction of European rabbits and foxes for sport hunting and of dogs and cats as pets has led to the extermination of nearly half the small- to medium-sized native marsupials over the last 100 years. As you saw in Key Concept 54.4, the use of biological control, or the deliberate introduction of species to control other invasive species, can sometimes cause even greater problems. Examples include the introduction of small predators such as mongoose to Hawaii to control rabbits and stoat (a type of weasel) to New Zealand to control rats. Instead of curbing the population sizes of rabbits and rats, these predators have been the major cause of bird species extinctions on these islands.
Sometimes invasions have occurred out of ignorance in what people believe are unlikely events of releasing non-native species (as was the case with the lionfishes described in Chapter 55). It can be difficult for people to imagine that species that are desirable and attractive in their place of origin can “go rogue” in a new region. Some of today’s most noxious weeds were deliberately transported and planted in new places for their beauty, fragrance, or culinary value.
A more inadvertent mechanism of introduction comes from species that stow away during transportation. For example, you saw how non-native species can be transported in ballast water in Key Concept 56.2. The brown tree snake (Boiga irregularis) arrived on Guam in air cargo shortly after World War II and today can be found at densities up to 5,000 individuals per square kilometer. The snake has exterminated 15 species of land birds, including 3 found only on Guam.
Introduced pathogens have also wreaked havoc among native species, as exemplified by the fungal pathogen Batrachochytrium dendrobatidis, or Bd for short, which is implicated in the dramatic worldwide declines of amphibians over the last 20 years. As described in the story opening this chapter, the disease may be responsible for the large percentage of amphibian declines recorded globally and for which there has been no clear explanation (the others being a result of some combination of habitat loss, overharvesting, exposure to UV radiation, or pollution). Such “rapidly declining” events have taken place on all the major continents and occur within well-protected areas such as Yosemite National Park (USA), Monteverde Cloud Forest Reserve (Costa Rica), and Eungella National Park (Australia). Most of the mass mortality events in which Bd has been implicated have not been observed because they happen so rapidly. Generally, researchers return to a site to find that population sizes are drastically reduced, or that some species are missing altogether, and discover the fungus present in some remaining individuals.
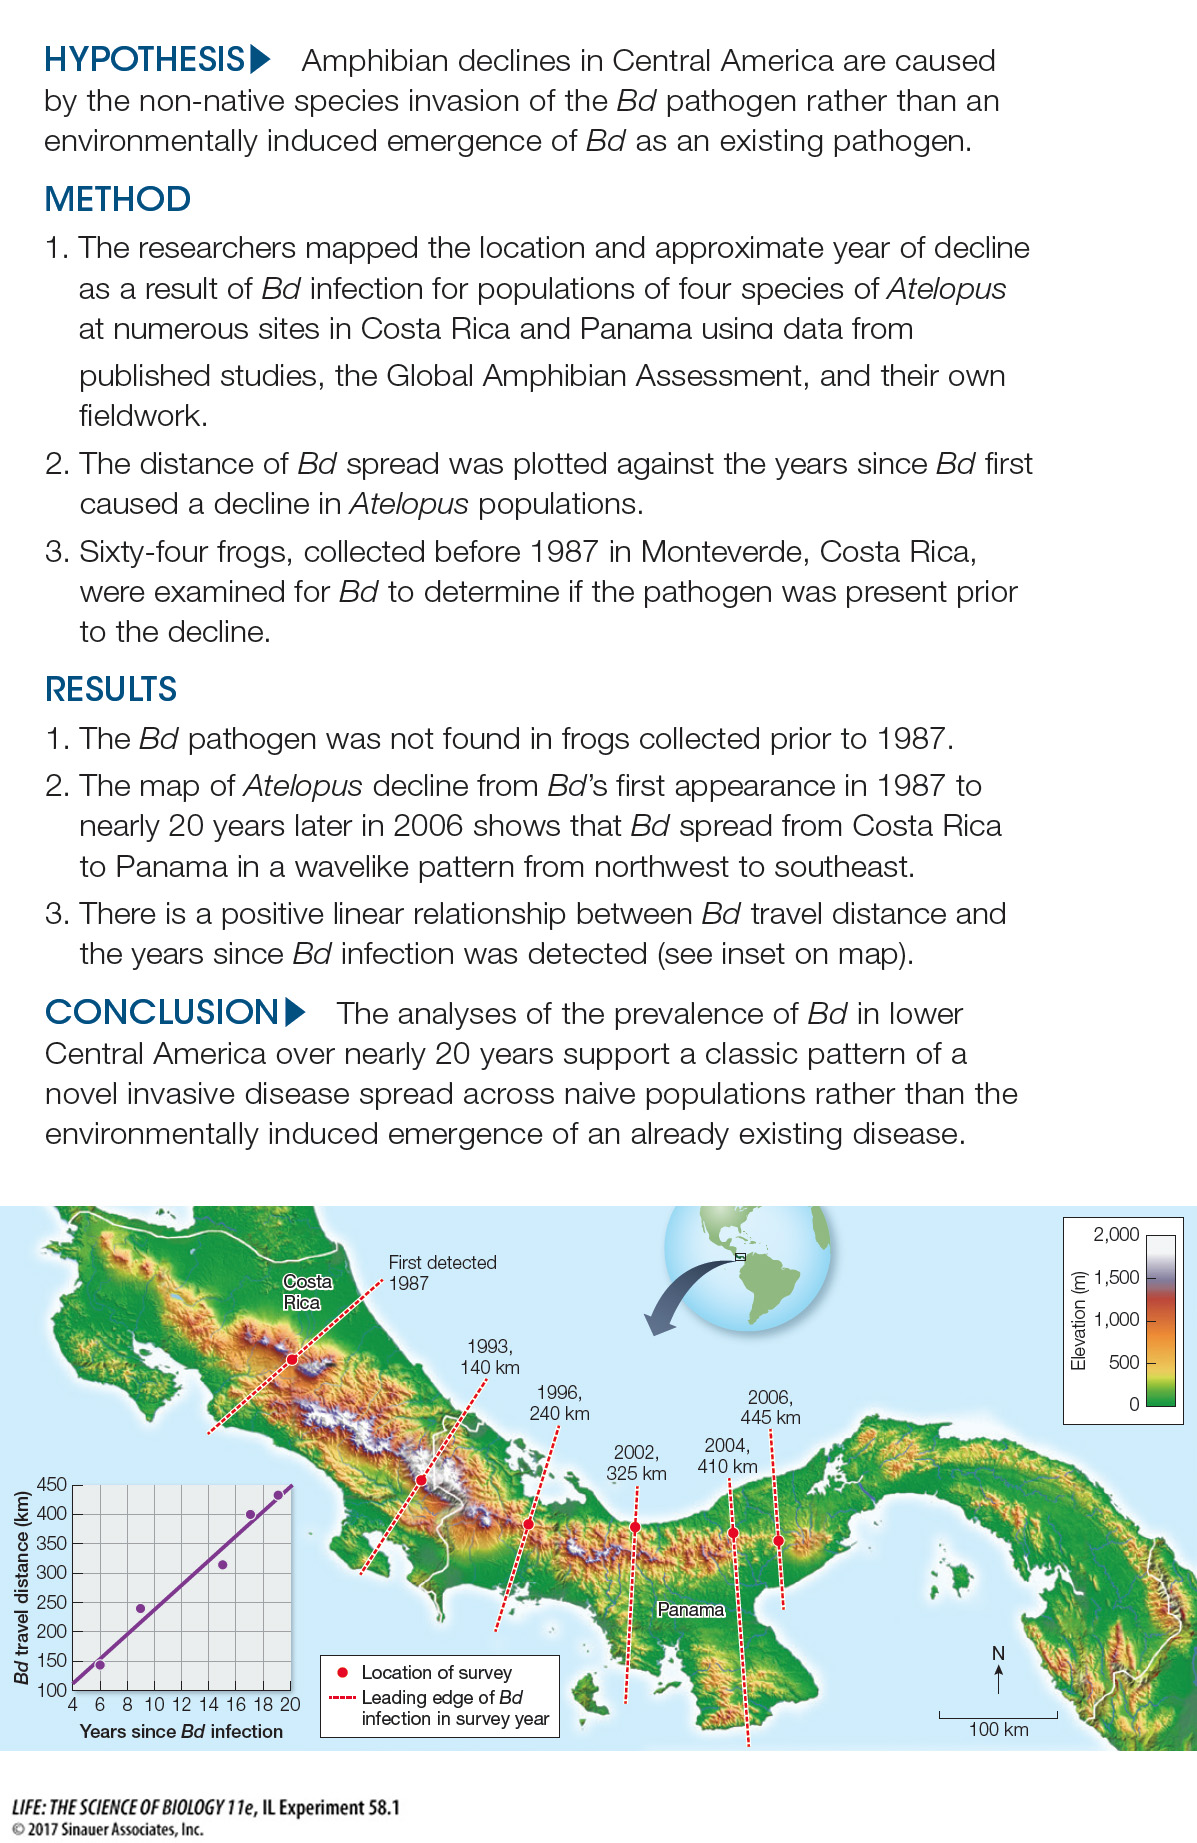
Researchers studying amphibian declines are interested in whether Bd is a novel and highly virulent pathogen that was recently introduced into wild populations (“novel pathogen hypothesis”) or if Bd existed prior to the declines but emerged as a serious pathogen as a result of human-caused environmental changes to climate or UV radiation (“emerging endemic hypothesis”). Although Bd seems to thrive under fairly specific environmental conditions (high-elevation streams with permanent water sources and temperatures between 12°C and 27°C), most of the evidence now suggests that Bd is a non-native pathogen likely introduced through the global trade in amphibians for food, for use as laboratory animals, or for use as pets or display animals. Investigating Life: Exploring the Decline of Central American Frogs describes research by Karen Lips and colleagues on the 20-year decline of four species of frogs in the genus Atelopus at multiple sites in Costa Rica and Panama. Their data suggest that the Bd pathogen traveled as an “invasion front” from infected to uninfected populations over time and that, based on microscopic tissue analyses of frogs collected prior to the declines, Bd was probably never present in this region of the world until its introduction in the 1980s. Of the four Atelopus species considered in this study, three species (A. chiriquiensis, A. senex, and A. zeteki) are likely extinct, and one species (A. varius; photo at chapter opening), thought to be extinct in 1996, likely exists only in a small population near Quepos, Costa Rica.
investigating life
Exploring the Decline of Central American Frogs
experiment
Original Paper: Lips, K., J. Diffendorf, J. Mendelson and M. Sears. 2008. Riding the wave: Reconciling the roles of disease and climate change in amphibian decline. PLoS Biology 6: e72.
Karen Lips and her colleagues studied the spread of the fungal pathogen Batrachochytrium dendrobatidis (Bd), implicated in the dramatic declines of frogs in the genus Atelopus seen in the moist and mountainous regions of lower Central America (Costa Rica and Panama) starting in the late 1980s. They compiled biogeographic reports of Atelopus declines and conducted microscopic tissue analyses to test whether Bd was a non-native pathogen species recently introduced to Central America or an existing disease that emerged as the result of changes in climate or the environment.
work with the data
The researchers were able to combine the distributional data of Bd infection from lower Central America with a much larger data set from South America to determine the percentage of Atelopus species that became extinct as a function of elevation. They found the following frog species extinctions with elevation:
| Elevation (m) |
Species extinctions (%) |
|
0–199 |
30 |
| 200–1,000 |
85 |
| 1,001–4,000 |
100 |
Question
1
The data from the results portion of the experiment can be used to calculate the rate of spread (km/year) of Bd by dividing the distance between pairs of locations (distance interval) by the number of years between the dates of decline. Calculate the rate of spread of the Bd pathogen between pairs of locations of frog declines (time interval). Is the rate of Bd spread similar among locations, or does it differ?
Distance interval
(km) |
Time interval
(years) |
Rate of spread
(km/yr) |
|
0-140 = 140 |
1987-1993 = 6 |
140/6 = 23 |
| 140-240 = 100 |
1993-1996 = 3 |
100/3 = 33 |
| 240-325 = 85 |
1996-2002 = 6 |
85/6 = 14 |
| 325-410 = 85 |
2002-2004 = 2 |
85/2 = 43 |
| 410-445 = 35 |
2004-2006 = 2 |
35/2 = 18 |
The rates of spread do differ. They range from 14 to 43 km/year depending on the location.
Question
2
Calculate the average rate of spread for the Bd pathogen in lower Central America. Predict how far and in what direction Bd could travel by 2016 (10 years).
The average rate of Bd spread is 26 km/year. Assuming this average, the pathogen could spread 260 km east and south by 2016 (26 km/yr × 10 years).
Question
3
Using the map elevations in the results section of the experiment, and the species extinction data above, is it likely that the Bd pathogen will spread, and cause species extinctions, in the direction and distance estimated in your answer to Question 2? If so, what is your best estimate of the percentage of species that would become extinct? Explain.
The majority of the habitat east and south of the last location where Bd was detected is mostly low elevation (0-199 meters), although there is a thin stretch of mountain habitat in the north. Given that far fewer frog species have become extinct because of Bd at elevations of 199 meters or less (30%), it seems less likely that the pathogen will be successful in this region of Panama. Based on the elevation data, the species extinction might reach 30%.
A similar work with the data exercise may be assigned in LaunchPad.