Chapter 12
A-
RECAP 12.1
The F1 generation showed only one phenotype and it was a parental phenotype; blending predicted that the F1 would show an intermediate phenotype, not like either parent. The F2 generation also showed the phenotype of the other parent, not seen in the F1; blending predicted that the phenotype would disappear.
BB × bb; bb × bb; Bb × bb; Bb × Bb
Autosomal dominant
¼
RECAP 12.2
In codominance, in a heterozygote both alleles are evident in the phenotype. In incomplete dominance, in a heterozygote an intermediate phenotype between the parents is seen.
In blood type AB, both the A and B alleles are expressed. On the red blood cell surface, two types of proteins are seen.
Yellow, blue, and white in a 1:2:1 ratio.
RECAP 12.3
Penetrance is the proportion of individuals with a certain genotype that actually show the phenotype associated with that genotype; that is, what proportion of pea plants with “Tall” genotype are tall? Expressivity is the extent to which a genotype actually shows its associated phenotype; that is, are all the pea plants with the “Tall” genotype equally tall, or is there a gradation of height?
Qualitative variation involves phenotypes, such as colors and textures, that cannot be easy measured; for example, green and yellow peas. Quantitative variations are phenotypes that can be measured; for example, tall and short pea plants.
75%
RECAP 12.4
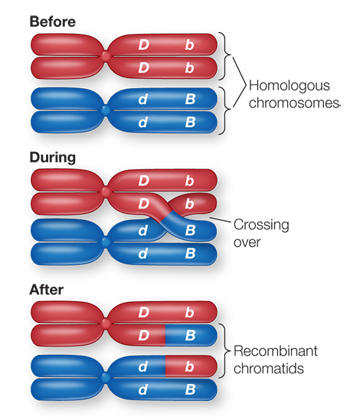
In genetic linkage, alleles on the same chromosome are generally carried together when a gamete is formed. That is, if in a heterozygote AaBb the A and B are on the same chromosome (and a and b on the other chromosome), gametes will be AB or ab.

A sex-
linked gene is carried on the X chromosome. In a genetic cross involving an organism with the XY system for sex differentiation, a sex- linked gene usually has no counterpart on the Y chromosome. So in an XY male, all X- linked alleles, dominant or recessive, are expressed in the phenotype. The cross RRYY × rryy produces RrYy (round, yellow) F1 offspring. If the seed shape and seed color genes were linked with no recombination between them, the F2 would also be all RrYy. A distance of 10 map units between two genes means that on average 10% of the F2 offspring will have recombinant phenotypes, in this case round green (5%) and wrinkled yellow (5%).
The cross in Figure 12.19 is BbVgvg (gray, normal) × bbvgvg (black, vestigial). If there were no linkage between the genes, then the gray, normal parent would produce four types of gametes: BVg, bVg, Bvg, and bvg. When these combine with the bvg gametes produced by the other parent, four types of offspring in a 1:1:1:1 ratio will result: BbVgvg (gray, normal), bbVgvg (black, normal), Bbvgvg (gray, vestigial), and bbvgvg (black, vestigial).
The body color (G/g) and wing size (A/a) genes are linked; eye color (R/r) is unlinked to the other two genes. The distance between the linked genes is 18.5 units.
RECAP 12.5
Because the gene is carried on mitochondrial DNA, it is passed through the mother only. Thus if the women does not have the disease but her husband does, their child will not be affected. However, if the woman has the disease but her husband does not, their child will have the disease.
RECAP 12.6
Mating and recombination allows genes to be exchanged between bacteria and results in a genetically diverse population of these organisms. Because they are haploid, any new gene combinations will be expressed in the recombined offspring.
A plasmid that integrates into the host chromosome will be stable when the cell divides and therefore any genes on the plasmid will be expressed. In addition, if the bacterium mates, the genes on the plasmid may be transferred to another cell.
Plasmids can carry genes that confer antibiotic resistance. When a bacterium carry a plasmid mates with one that does not, the plasmid replicates and transfers one of the copies to the recipient bacterium. Now there are two bacteria with antibiotic resistance.
WORK WITH THE DATA, P. 243
The chi-
square goodness- of- fit test is explained in Appendix B, on pp. 1285–1286. The formula for calculating chi- squared is given in Research Tools Figure B12. A-
13 Cross Chi- squared P- value 1 0.33 0.57 2 0.69 0.40 3 0.02 0.8 4 0.24 0.59 5 1.52 0.21 6 0.05 1 7 0.19 0.66 8 1.41 0.23 9 0.19 0.66 10 0.35 0.55 All the individual crosses have P-values greater than 0.05, so no significant difference from a 3:1 ratio.
Combined data: Chi-
squared 0.11, P = 0.74. In this case, similar P-values were obtained both for the individual crosses (small sample size) and for the combined dataset (large sample size).
WORK WITH THE DATA, P. 257
Using a chi-
squared test with 3 degrees of freedom the chi- squared value is 429.96 and the P-value is less than 0.0001. This indicates a highly significant deviation from the expected 9:3:3:1 ratio. The genes are linked, because there are more parental type phenotypes and fewer recombinant (non-
parental) phenotypes in the test cross progeny than would be expected for unlinked genes. The map distance is:
[(578 + 307) / (578 + 307 + 1413 + 1117)] × 100 = 26 map units
These data are different from the data shown in Figure 12.17, because the parental types are different: black normal and gray vestigial in this cross, and gray normal and black vestigial in Figure 12.17.
BBVgVg and bbvgvg
FIGURE QUESTIONS
Figure 12.2 7
Figure 12.11 Yellow: BBee and Brown: bbEE.
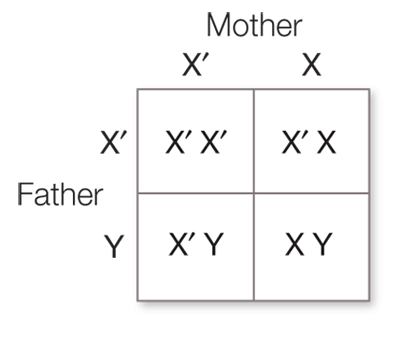
Figure 12.18 Heterozygous, XRXr. The female parent passed the Xr chromosome to the offspring, which had a Y chromosome from the male parent.
APPLY WHAT YOU’VE LEARNED
F1 genotype: 100% DdBb
F1 phenotype: 100% long legs, gray body
F2 genotypes: 1:2:1 ratio 25% DDbb:50% DdBb:25% ddBB
F2 phenotypes: 25% long legs, black body; 50% long legs, gray body; 25% short legs, gray body
F1 genotype: 100% BbCc
F1 phenotype: 100% gray body, straight wings
F2 genotypes: 1:2:1 ratio 25% BBcc:50% BbCc:25% bbCC
F2 phenotypes: 25% gray body, curved wings; 50% gray body, straight wings; 25% black body, straight wings
In the F2 generation of the DDbb × ddBB cross, you would also find the short legs, black body phenotype (ddbb genotype), which would be a new phenotype not observed earlier.
In the second case, the F2 generation of the BBcc × bbCC cross, you would find the black body, curved wings phenotype (bbcc genotype), which would be a new phenotype not observed earlier.
The BBcc × bbCC cross would produce the larger frequency of recombinants because the distance between the two linked loci (B and C) is longer (75.5 – 48.5= 27.0 map units) than the distance between the two linked loci (D and B) (48.5 – 31.0=17.5 map units). There is a greater probability of crossing over with a longer distance between linked loci.