Chapter 4
RECAP 4.1
Purines contain two nitrogen–
carbon rings, while pyrimidines have one ring. The double helix of DNA has uniform width because a purine on one strand is always opposite a pyrimidine on the other strand. While DNA molecules are similar in diameter and configuration, their base sequences are different. Differences in base sequence provide the informational content of DNA.
The number of possible 25-
unit sequences of four nucleotides is 425, a large number indeed. Because of internal base pairing of the single strand (as in RNA), many folded configurations are possible, which allows specific binding to target molecules.
RECAP 4.2
The presence of O2 in the atmosphere produces an oxidizing condition that prevents the reduction reactions observed in the Miller–
Urey experiment. If microbes survived heat, the initial part of Pasteur’s experiment might begin with microbes already present. They would grow in both the open and closed flasks. To get the results that Pasteur did, his flasks must not have contained such microbes. An answer for the proposed experiment on heat-
stable microbes might be to inactivate them using reagents, such as mercaptoethanol, that destroy proteins. A suggested experiment might be to dry the samples after the Miller–
Urey experiment (allowing condensation reactions— polymerization) and then apply energy in the form of heat. This condition might have existed in volcanic rock on early Earth.
RECAP 4.3
A hallmark of living systems is the ability to reproduce, and this occurs from preexisting organisms. The instructions for producing an identical organism must be passed on to the offspring. This implies informational molecules. In living systems, chemical changes constantly occur, but in ordinary chemistry they are too slow to benefit the organism. So catalysts are needed to speed up the reactions.
A challenge in developing theories for the origin of life was the need for both a molecule that could carry information and a molecule that could act as a catalyst. Without either, life as we know it could not exist. That an informational molecule, RNA, could also act as a catalyst solved this challenge; ribozymes, also known as catalytic RNA or RNAzyme, are RNA molecules that are capable of catalyzing specific biochemical reactions.
A-
5 Most catalysts in living systems are proteins. But the polymerization of amino acids into proteins that are catalytic must have happened before the protein catalysts were initially formed. Having an RNA, that perhaps was originally informational, act as the catalyst for protein formation solves this “chicken–
egg” issue.
RECAP 4.4
The cell membrane forms a compartment in which the chemicals needed for the reactions of life can be concentrated. The membrane creates a suitable internal chemical environment for the organism that is distinct from that of the environment.
First, examine rocks that are more than 3 billion years old. Then look at slices of rocks under microscopes for objects that look like cells or chains of cells. Finally, chemically analyze the rocks for chemical signatures for life, such as a carbon isotope ratio resulting from photosynthesis.
WORK WITH THE DATA, P. 74
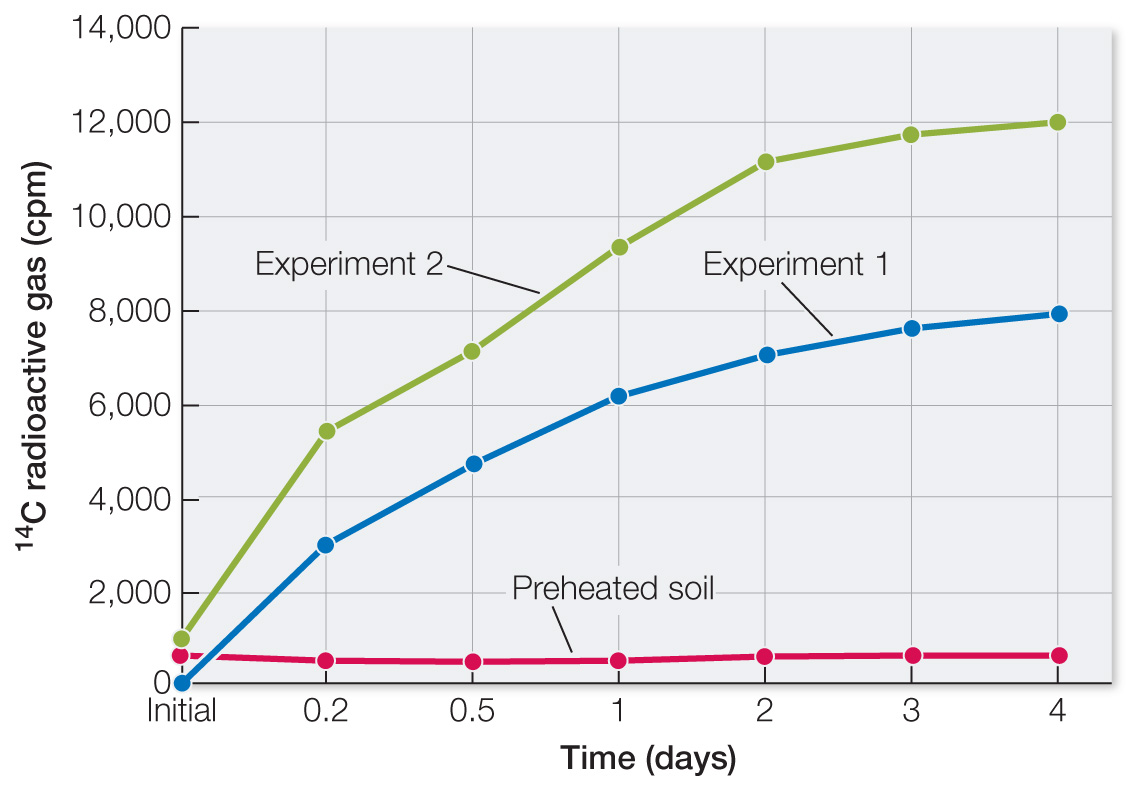
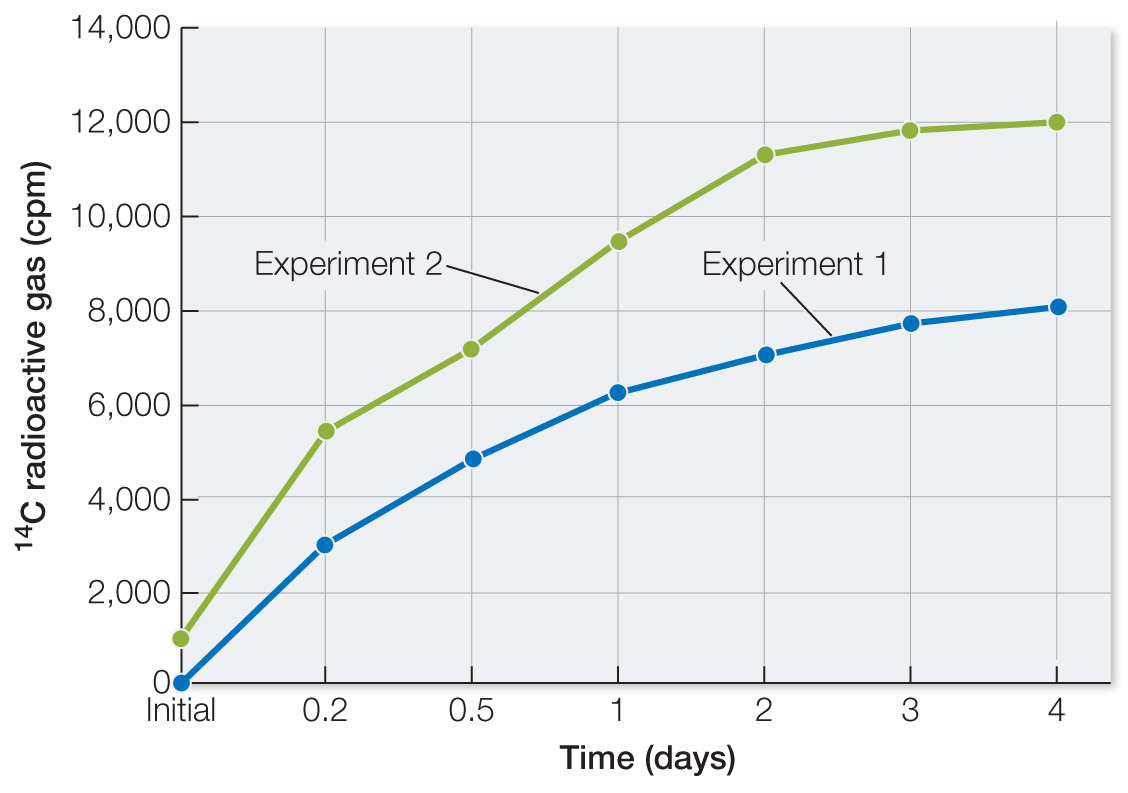
Plot the data. In both experiments with unheated soil, there was a modest time-
dependent increase in 14C- labeled gases. These data are consistent with living organisms converting the molecules supplied into gases. The amount of gas produced was small in comparison with lab- based experiments: average radioactivity was 10,000 cpm, while potential was 257,000 cpm. Efficiency of production of gases was 10,000/257,000 = 0.038 = 4%. 
The graph of the data shows no increase in 14C gases. Heat destroys hydrogen bonds in proteins and nucleic acids. Again, these data are consistent with living organisms having produced 14C gases.

The data for hematite are similar to the data for Martian soil. So while the Martian soil data are consistent with life, they are also consistent with non-
living soil components.
FIGURE QUESTIONS
Figure 4.3 If a folded RNA molecule were heated, hydrogen bonds between bases in the RNA would break and the molecule would assume a random shape, losing its specific shape.
Figure 4.4 Hydrogen bonds
Figure 4.5 There must be specific information in DNA sequences that signal their transcription. These specific sequences must bind to proteins that are involved in transcription.
APPLY WHAT YOU’VE LEARNED
The ratio of purines (A + G) to pyrimidines (C + T) is always one-
to- one. This pattern is observed because of the double helix structure and base pairing between the two strands making up the double helix. There is always one purine on one strand and a pyrimidine that pairs with it on the complementary strand. DNA A G Purines C T Pyrimidines Ratio purines
to pyrimidinesHerring sperm 27.8 22.2 50 22.6 27.5 50.1 1.00 Rat bone marrow 28.6 21.4 50 21.5 28.4 49.9 1.00 Human sperm 30.7 19.3 50 18.8 31.2 50 1.00 E. coli 26 24.9 50.9 25.2 23.9 49.1 1.04 Yeast 31.3 18.7 50 17.1 32.9 50 1.00 The ratio of purines (A + G) to pyrimidines (C + U) ranges from 0.87 to 1.24, with lots of variation in between. Therefore there is no constant pattern in this ratio in RNA across many species. This indicates that the number of purines and pyrimidines varies within an RNA strand, which we know to be single-
stranded. RNA A G Purines C U Pyrimidines Ratio purines
to pyrimidinesRat liver 19.2 28.5 47.7 27.5 24.8 52.3 0.91 Carp muscle 16.4 34.4 50.8 31.1 18.1 49.2 1.03 Yeast 25.1 30.2 55.3 20.1 24.6 44.7 1.24 Rabbit liver 19.7 26.8 46.5 25.8 27.6 53.4 0.87 Cat brain 21.6 31.8 53.4 26.0 20.6 46.6 1.15 The difference in ratios of purines to pyrimidines in DNA and RNA across species highlights the double-
stranded nature of DNA and the single- stranded nature of RNA. Only in the double- stranded structure would you have a constant ratio of purines to pyrimidines because they are paired in a one- to- one ratio. In single- stranded RNA, there is no requirement for pairing purines and pyrimidines, and the variability in their content reflects differences in the genetic sequences of the strands. Only E. coli has about equal AT and GC content. Human sperm and yeast have more AT than GC content, and rat bone marrow and herring sperm have more GC than AT content.
DNA A G C T A+T G+C Herring sperm 27.8 22.2 22.6 27.5 55.3 44.8 Rat bone marrow 28.6 21.4 21.5 28.4 57 42.9 Human sperm 30.7 19.3 18.8 31.2 61.9 38.1 E. coli 26.0 24.9 25.2 23.9 49.9 50.1 Yeast 31.3 18.7 17.1 32.9 64.2 35.8 Herring sperm and rat bone marrow cells have similar AT and GC content. Their genetic makeups are determined by the sequences of bases in DNA, so even though they have similar overall base content, they each have unique sequences of all bases—
A, T, G, and C— that encode the genes within the DNA.