Using the Graph
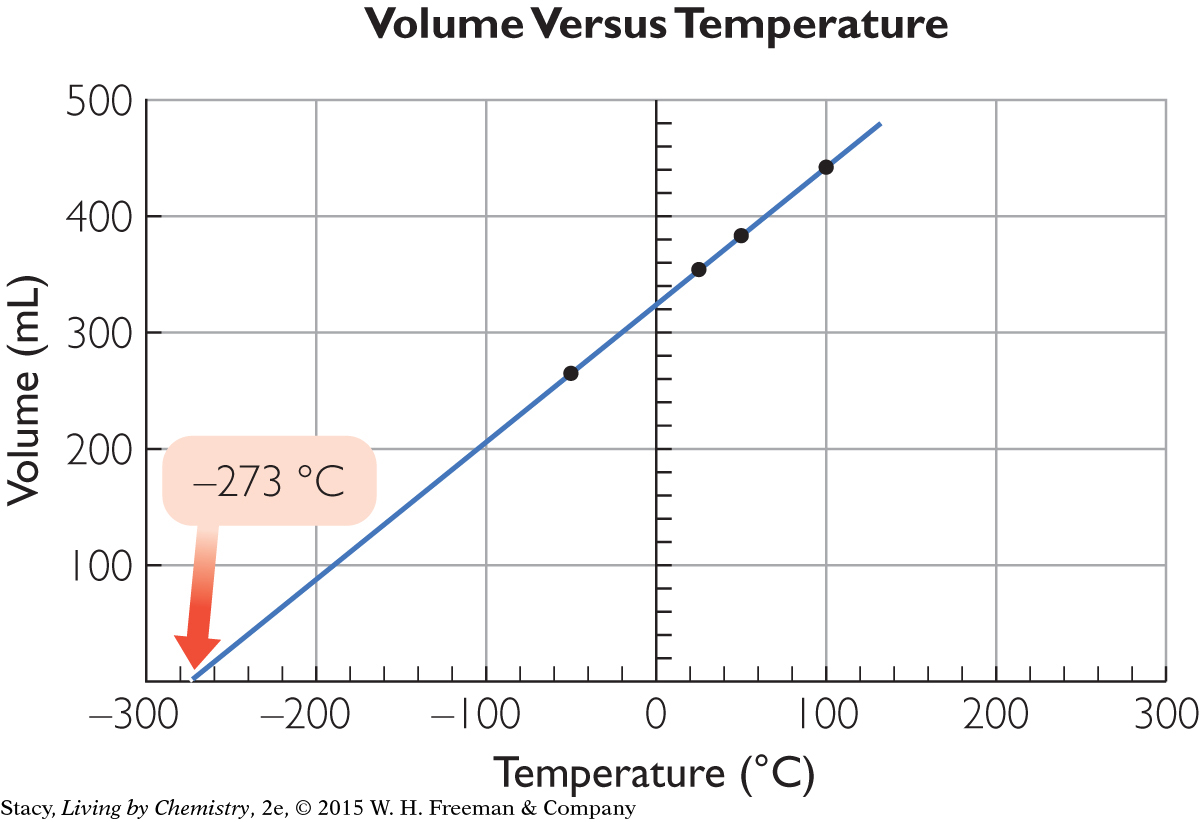
This graph shows that as the temperature decreases, the volume decreases in a predictable way. The data points lie more or less on a straight line. If you extend this line to the x-axis, you can determine the theoretical temperature of the gas at zero volume.