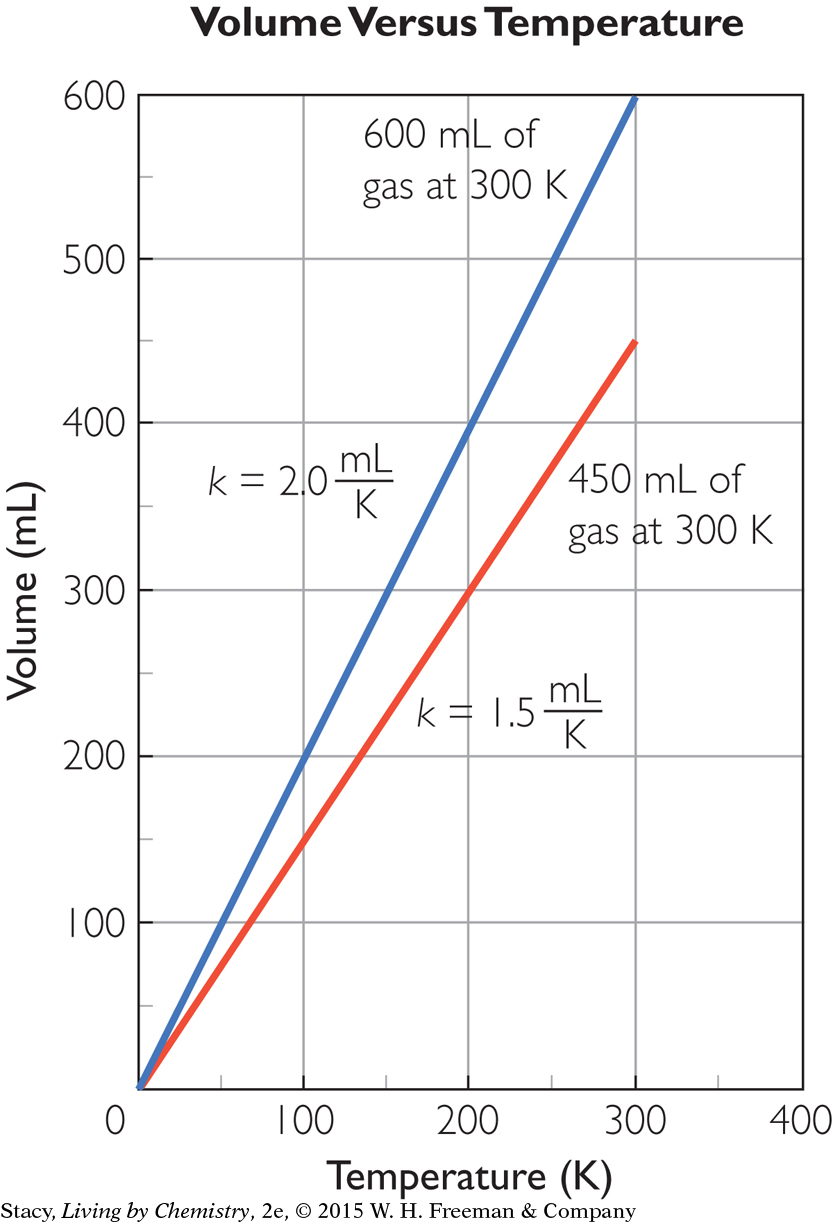
Using the Graph
Because the relationship between temperature and volume is proportional, the lines pass through the origin. The slope of each line is equal to the proportionality constant for that sample. You can use the graph to predict the volume of either gas sample at any temperature.