LESSON 50: Raindrops Keep Falling: Measuring Liquids
263
THINK ABOUT IT
After a rainstorm, rain in the gutter or in a puddle can be several inches deep, yet on the sidewalk and grass, it may not be that deep. The water runs off the sidewalks, runs down hills, collects in depressions, and soaks into grass. So, how do you determine how much rain fell?
How do meteorologists keep track of the amount of rainfall?
To answer this question, you will explore
Rain Gauges
Volume Versus Height
Proportional Relationships
Rain Gauges
EXPLORING THE TOPIC
Rain Gauges
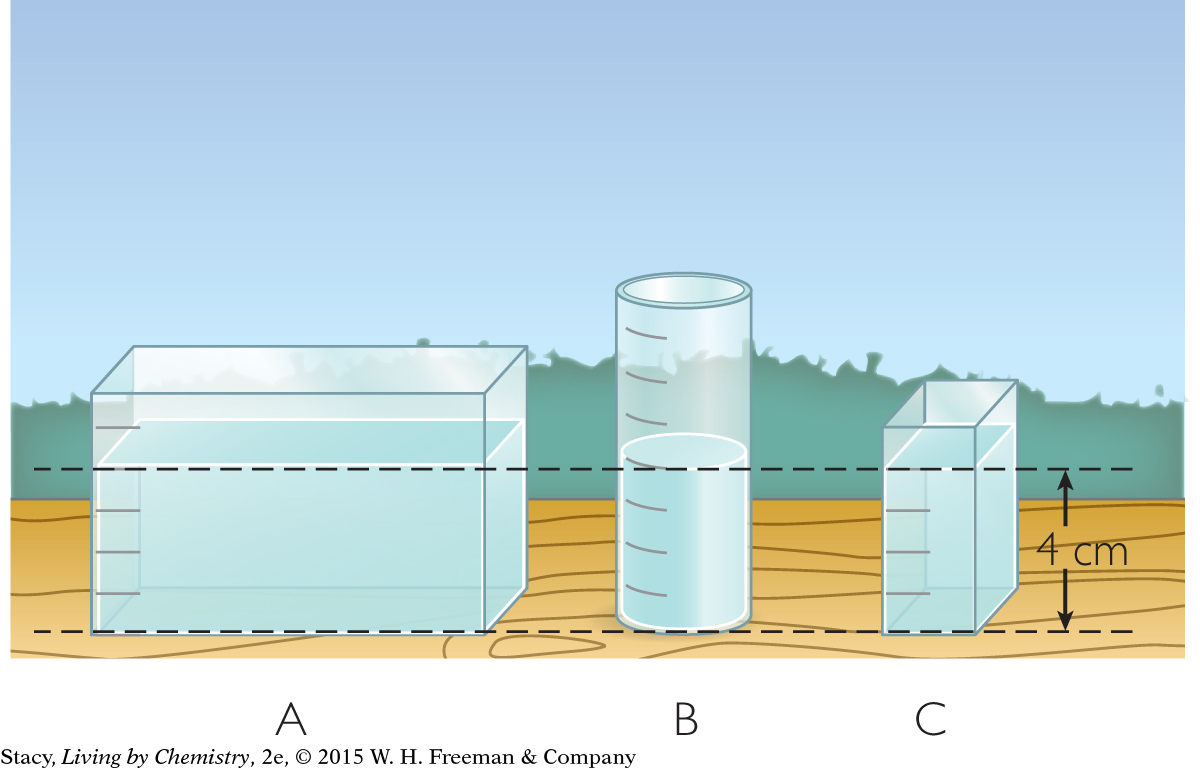
Suppose you have three rain gauges that are different sizes. You place them next to one another out in the rain. After a few hours, these containers might look like this:
Sample data for these three containers are given in the table below.
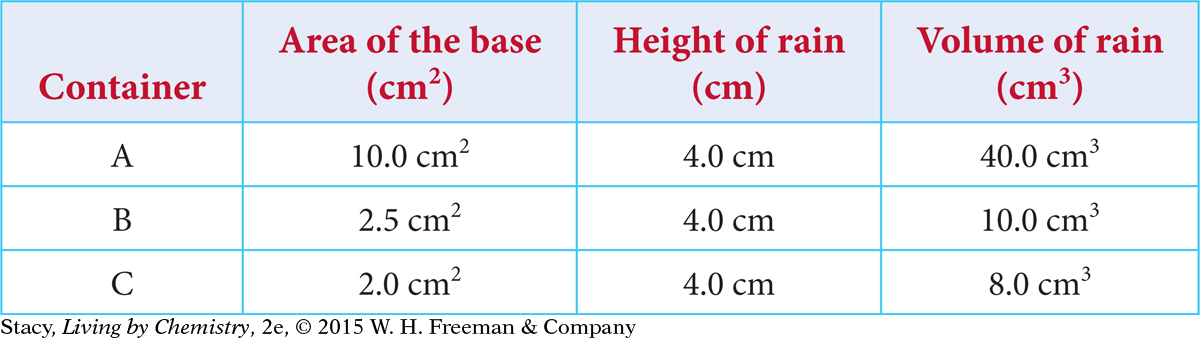
You can see that the volume of rain in each container is quite different. However, the height of rain is the same. This is why meteorologists report height of rainfall, in centimeters or inches, not volume of rainfall. The height of rainfall is the same for these containers, but the volume is not.
Volume Versus Height
Volume Versus Height
264
Imagine that you place a rain gauge with a square base of 2.0 cm2 in a steady rain for several hours. Each hour, you go outside to measure how much rain has collected in the rain gauge.
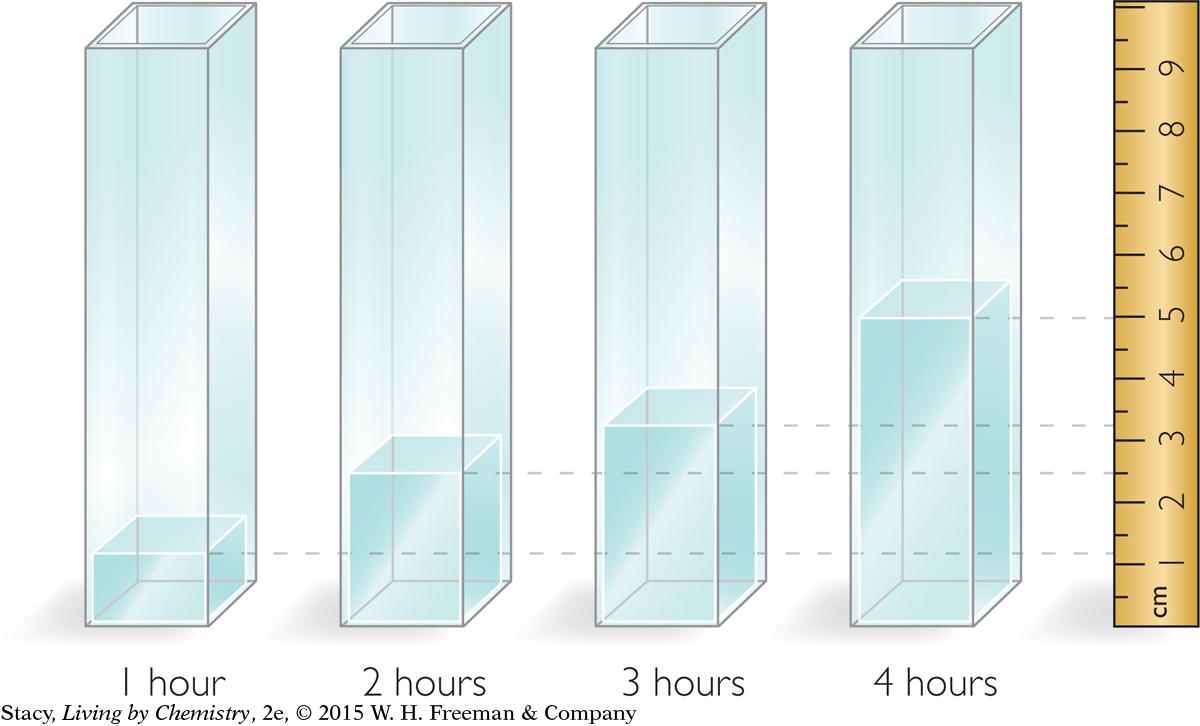
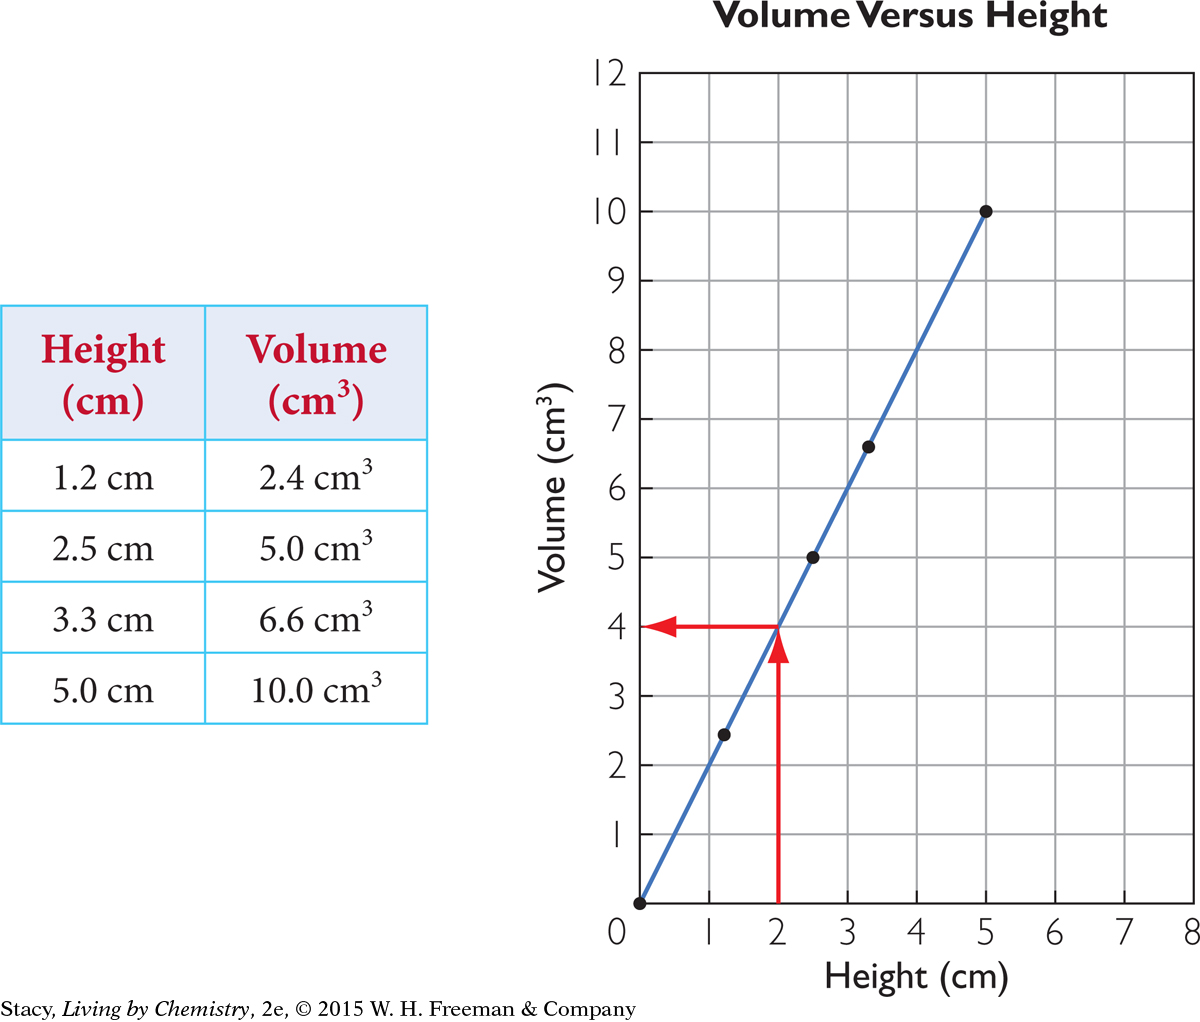
The graph shows how volume changes as height changes, or volume versus height. Versus means compared with and is abbreviated vs. Both the volume and the height of the rain in the gauge increase as more rain is collected. Take a moment to examine the data.
The graph shows that volume increases in a steady and predictable way in relationship to height. And once some data points are known, others can be predicted.
265
Suppose you want to predict the volume of water when the height is 2.0 cm. You can either use the graph to find the answer or use math to calculate it. [For review of this math topic, see MATH Spotlight: Graphing on page A-8.]
Important to Know
In the lab, volume is measured in milliliters, mL, in a graduated cylinder. Conveniently, 1 mL = 1 cm3.
Method 1: First, find the height, 2.0 cm, on the x-axis. Move vertically from this spot until you reach the slanted line. Now move horizontally until you reach the y-axis. This point on the line corresponds to a volume of 4.0 cm3.
Method 2: Notice that for every data point in the table, the volume is always 2 times the height. The volume for a height of 2.0 cm is 4.0 cm3. Similarly, the volume for a height of 6 cm would be 6 · 2 = 12 cm3.
Proportional Relationships
Proportional Relationships
The relationship between a container’s volume and its height is a proportional one. This means that volume and height are related to one another by a single number called the proportionality constant. When the height is multiplied by this number, you get the volume. In the example we just used, the height and volume of rain in the rain gauge were related by the number 2.0. In other words, for this container, the volume is always 2.0 times the height, and 2.0 is the proportionality constant.
AGRICULTURE CONNECTION
AGRICULTURE
CONNECTION
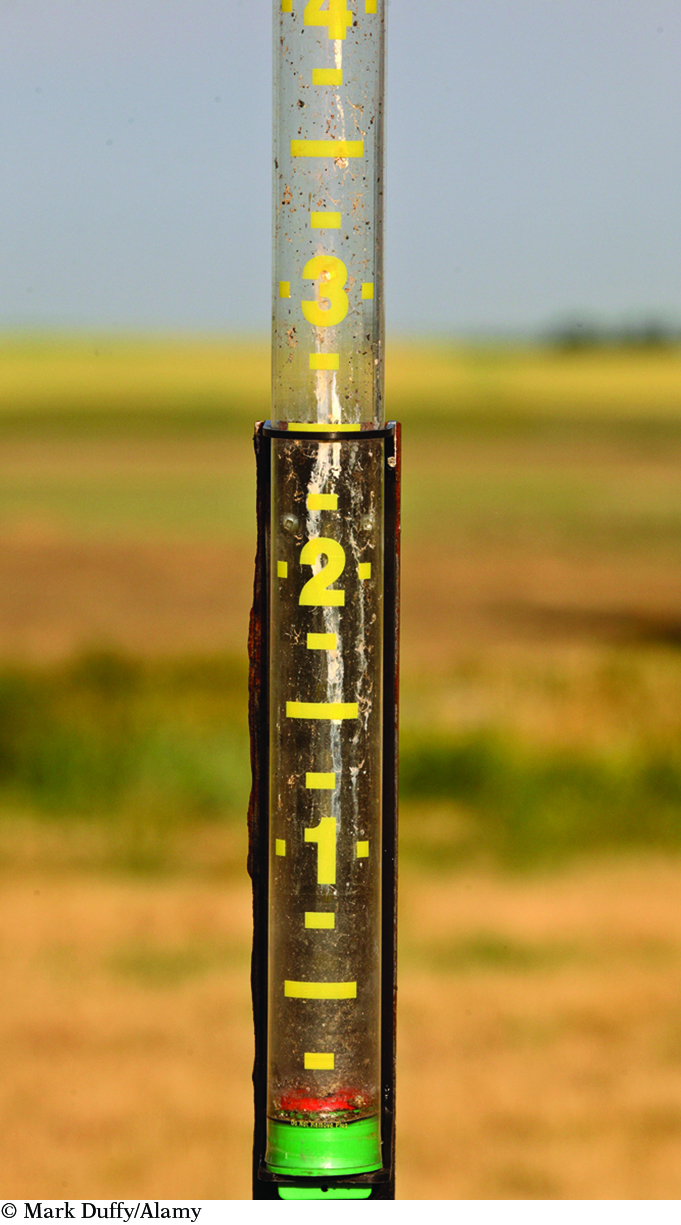
Rain gauges often have a wide funnel to collect water into a narrow tube. Because the collection area is large, the height corresponding to 1 inch of rain in the rain gauge is much larger than an actual inch. Rain gauges allow a farmer to see these “large inches” of water from inside his or her home without having to walk out to the field in the rain.
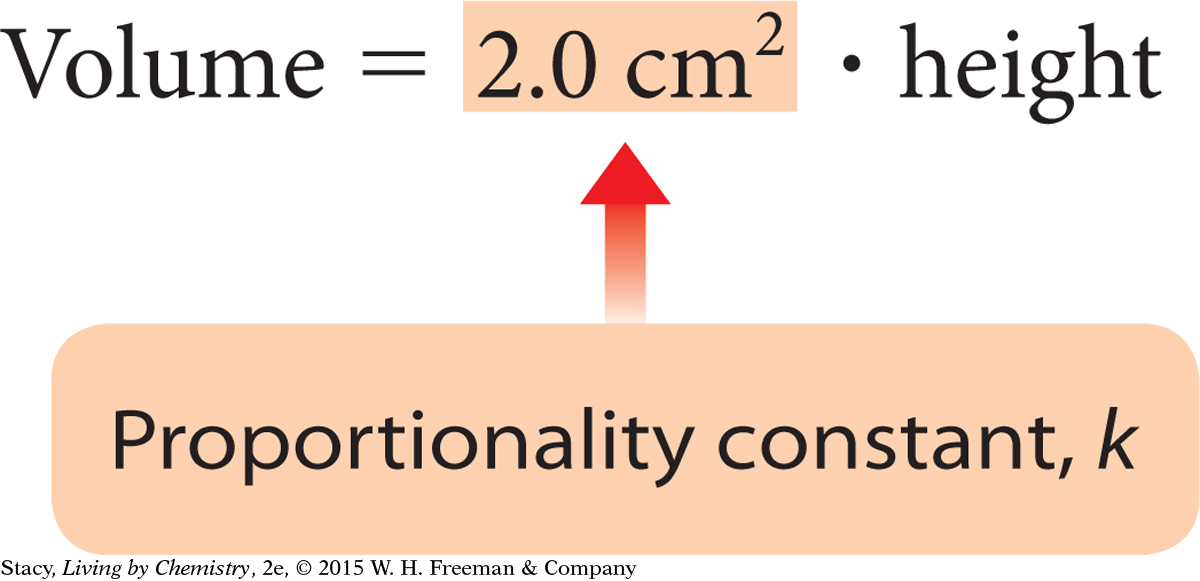
Volume of rain = (proportionality constant) · (height of rain)
A proportionality constant can be represented by the letter k in a math formula.
Volume = k · height
In the case of the rain gauge, the proportionality constant is also equal to the area of the base.
The graph provides another way to look at proportional relationships. Whenever two variables are proportional to each other, the graph of the data points is always a straight line passing through the origin (0, 0). [For review of this math topic, see MATH Spotlight: Ratios and Proportions on page A-11.]
Volume and height are proportional for containers with a uniform shape and parallel walls.

Amount of rainfall is not proportional to time. This is because rainfall is not necessarily steady. It can rain a lot and then a little.
266
LESSON SUMMARY
LESSON SUMMARY
How do meteorologists keep track of the amount of rainfall?
KEY TERMS
proportional
proportionality constant
Everywhere around the world, the amount of rainfall is measured by its height. If volume were used to report rainfall, each meteorologist would report a different number, depending on the area of the base of the rain gauge used. Height and volume for a specific rain gauge are related by a proportionality constant, k.
Exercises
Reading Questions
Suppose you have a cylindrical rain gauge with a base area of 2.0 cm2. Explain two different ways you can determine the volume when the height of water is 3.0 cm.
Explain in your own words why meteorologists prefer to measure rain in inches or centimeters, not in milliliters or cubic centimeters.
Reason and Apply
If the amount of rainfall increases, do both the volume and height of water in the rain gauge keep track of this increase? Explain your thinking.
If you use a beaker for a rain gauge and the weather station uses a graduated cylinder, will both instruments give the same volume? The same height?
If a large washtub, a dog’s water dish, and a graduated cylinder were left outside during a rainstorm, would the three containers all have the same volume of water in them after the storm? Explain why or why not.
Inches are used in the United States, but centimeters are used by scientists and in the rest of the world. Look at a ruler that is marked in both inches and centimeters.
Make a graph of centimeters versus inches so that the y-axis is centimeters and the x-axis is inches.
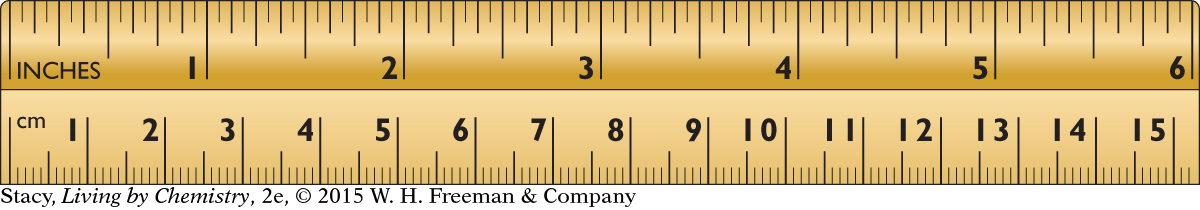
Convert 12 in. to centimeters.
How many inches is 10 cm?
How many inches is 1 cm?
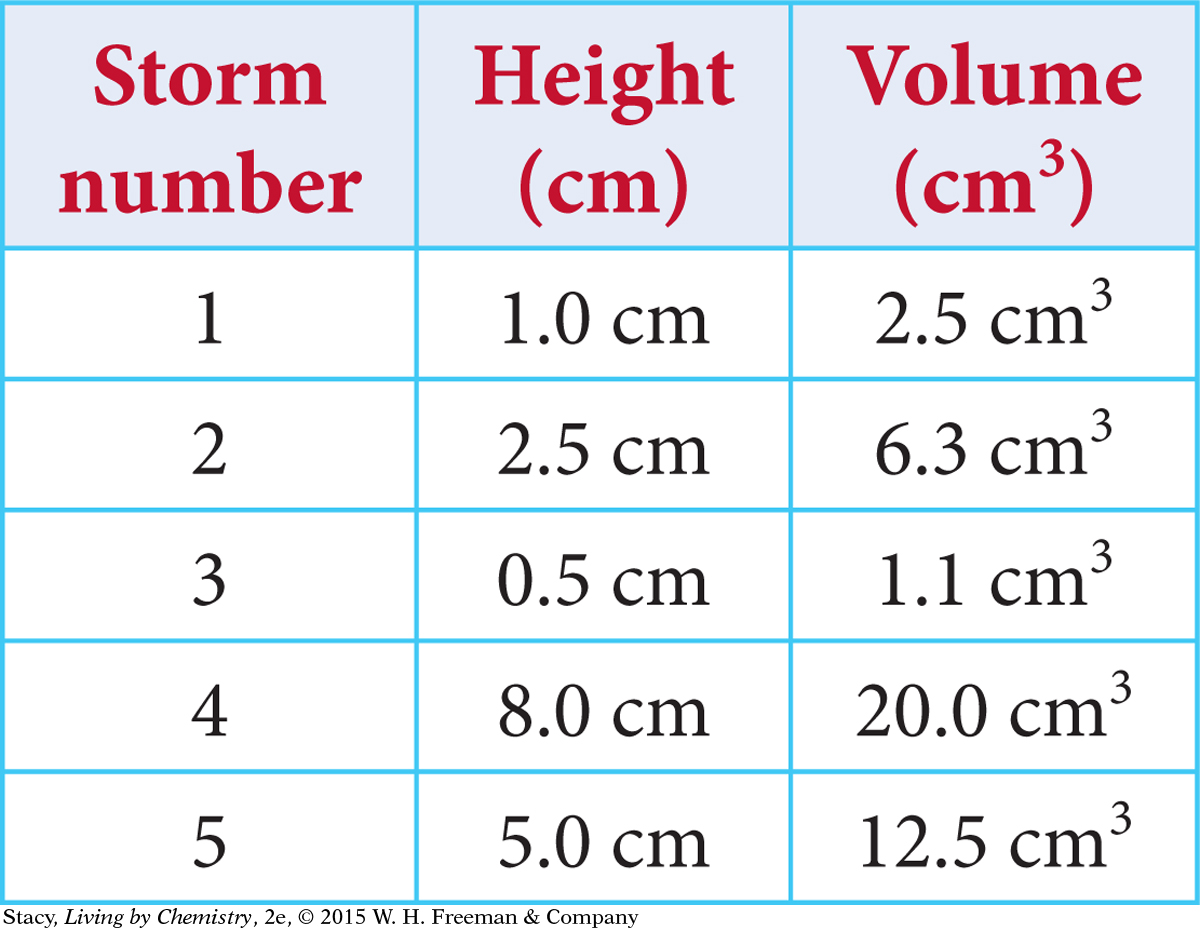
A student placed the same empty rain gauge outside before five different rainstorms. She measured the height and volume of the water in the gauge after each storm. Her results are in the table.
Which rainstorm dropped the most rain? Did you use height or volume to answer this question? Why?
What pattern do you notice?
Draw a graph of the data to show that the volume and height are proportional.
Explain why the data points do not all lie exactly on a straight line.
Predict the volume for a height of 6.0 cm. Show your work.