Researchers Use Multiple Tools to Study the Cell Cycle
The experimental analysis of cell cycle properties requires that we be able to determine the cell cycle stage of individual cells. Light microscopy provides some estimate of cell cycle progression. For example, light microscopy allows a researcher to determine whether cultured mammalian cells are in interphase (G1, S phase, and G2) or in mitosis. Mammalian tissue culture cells are flat and adhere to their growth surface during interphase, but round up and form spherical structures as they undergo mitosis (Figure 19-7). Fluorescence microscopy of cellular structures or analysis of specific cell cycle markers—that is, proteins that are present only in certain cell cycle stages—allows for a more accurate determination of cell cycle stage.
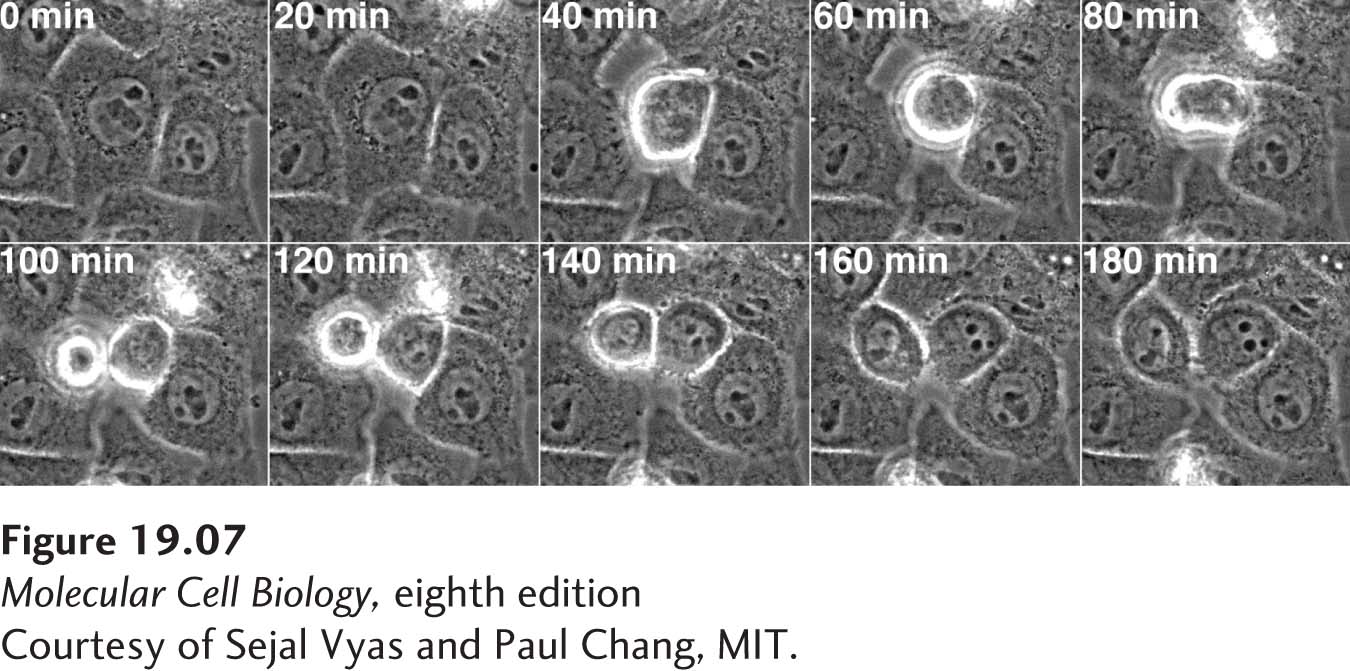
FIGURE 19-7 Human cells undergoing mitosis. HeLa Kyoto cells were filmed as they underwent mitosis. The images shown were taken every 20 minutes. Cells are flat during interphase, but as cells undergo mitosis, they round up and divide. Subsequently, they flatten out again.
[Courtesy of Sejal Vyas and Paul Chang, MIT.]
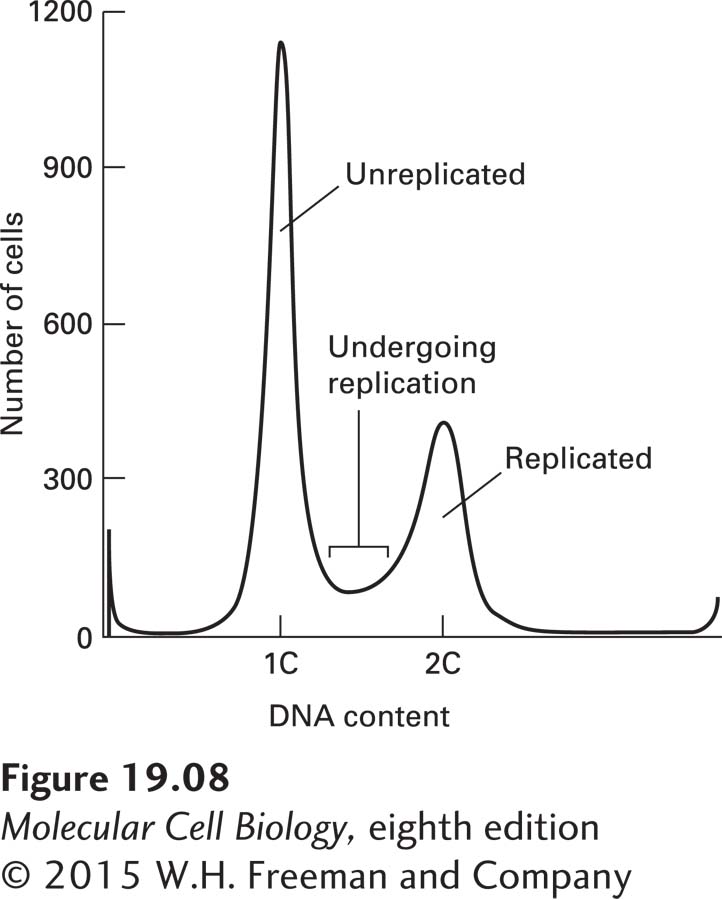
EXPERIMENTAL FIGURE 19-8 Analysis of DNA content by flow cytometry. Haploid yeast cells were grown in culture and stained with propidium iodide, a fluorescent dye that is incorporated into DNA. The x axis shows DNA content, the y axis the number of cells. The DNA content analysis shows two predominant populations of cells: cells with unreplicated DNA (1C) and with replicated DNA (2C). The cells between the two peaks represent cells that are in the process of undergoing DNA replication.
In addition to microscopic tools, cell cycle researchers use flow cytometry to determine the DNA content of a cell population (Figure 19-8; see also Figure 4-2). Cells are treated with a DNA-binding fluorescent dye, and the amount of dye that is incorporated into the DNA of cells can then be quantitatively assessed using a flow cytometer. Cells are then recorded by their DNA content, and the percentages of cells in G1, S phase, and G2 or mitosis can be assessed in this manner. Cells in G1 have half as much DNA as cells in G2 or mitosis. Cells undergoing DNA synthesis in S phase have an intermediate amount of DNA.
To characterize different cell cycle events, it is essential to examine cell populations that progress through the cell cycle in unison. Researchers can generate such populations by reversibly arresting cells in a particular cell cycle stage. This cell cycle arrest is usually accomplished by restricting nutrients or by adding anti-growth factors, which cause cells to arrest in G1. In budding yeast, for example, cells treated with a mating pheromone arrest in G1 (see Figures 16-23 and 16-24). When the pheromone is removed from the cells (usually by washing them extensively), the cells exit G1 and progress through the cell cycle in a synchronous manner. In mammalian cells, removal of growth factors by removing serum from the culture medium (serum starvation) arrests cells in G0. Re-addition of serum allows cells to re-enter the cell cycle. Other methods involve blocking a certain cell cycle step with chemicals. Hydroxyurea inhibits DNA replication, leading to arrest in S phase. On removal of the drug, cells will resume DNA synthesis in unison. Nocodazole disrupts the mitotic spindle and halts the cell cycle in mitosis. Once the drug is washed away, cells will resume progression through mitosis in a synchronous manner. In budding and fission yeasts, the conditional cdc mutants introduced earlier have proved to be a powerful tool for creating synchronous cultures. Temperature-sensitive cdc mutants, when incubated at the non-permissive temperature, arrest in a particular cell cycle stage because they are defective in a certain key cell cycle protein. Returning cells to the permissive temperature allows them to continue with the cell division cycle in a synchronous fashion.