DNA Microarrays Can Be Used to Evaluate the Expression of Many Genes at One Time
Monitoring the expression of thousands of genes simultaneously is possible with DNA microarray analysis, another technique based on the concept of nucleic acid hybridization. A DNA microarray consists of an organized array of thousands of individual, closely packed, gene-specific sequences attached to the surface of a glass microscope slide. By coupling microarray analysis with the results from genomic sequencing projects, researchers can analyze the global patterns of gene expression in an organism during specific physiological responses or developmental processes.
Preparation of DNA Microarrays In one method of preparing microarrays, a DNA segment of about 1 kb corresponding to part of the coding region of each gene to be analyzed is individually amplified by PCR. A robotic device is used to apply each amplified DNA sample to the surface of a glass microscope slide, which is then chemically processed to permanently attach the DNA sequences to the glass surface and to denature them. A typical array might contain some 6000 spots of DNA in a 2 × 2–cm grid.
In an alternative method, multiple DNA oligonucleotides, usually at least 20 nucleotides in length, are synthesized from an initial nucleotide that is covalently bound to the surface of a glass slide. The synthesis of an oligonucleotide of specific sequence can be programmed in a small region on the surface of the slide. Several oligonucleotide sequences from a single gene are thus synthesized in neighboring regions of the slide. With this method, oligonucleotides representing thousands of genes can be produced on a single glass slide. Because the methods for constructing these arrays of synthetic oligonucleotides were adapted from methods for manufacturing microscopic integrated circuits used in computers, these types of oligonucleotide microarrays are often called DNA chips.
Using Microarrays to Compare Gene Expression Under Different Conditions The initial step in a microarray expression study is to prepare cDNAs from the mRNAs expressed by the cells under study and attach fluorescent labels to them. When the cDNA preparation is applied to a microarray under appropriate conditions, DNA spots representing genes that are expressed will hybridize to their complementary cDNAs in the labeled probe mix and can subsequently be detected in a scanning laser microscope.
Figure 6-26 depicts how this method can be applied to examine the changes in gene expression observed after starved human fibroblasts are transferred to a rich, serum-containing growth medium. In this type of experiment, the separate cDNA preparations from starved and from serum-grown fibroblasts are labeled with differently colored fluorescent dyes. A DNA microarray comprising 8600 mammalian genes is then incubated with a mixture containing equal amounts of the two cDNA preparations under hybridization conditions. After unhybridized cDNA is washed away, the intensity of green and red fluorescence at each DNA spot is measured using a fluorescence microscope and is recorded under the name of each gene according to its known position on the slide. The relative intensities of red and green fluorescence signals at each spot provide a measure of the relative level of expression of that gene in response to serum. Genes that are not transcribed under these growth conditions give no detectable signal. Genes that are transcribed at the same level under both conditions hybridize equally to both red- and green-labeled cDNA preparations. Microarray analysis of gene expression in fibroblasts showed that transcription of about 500 of the 8600 genes examined changed substantially after addition of serum.
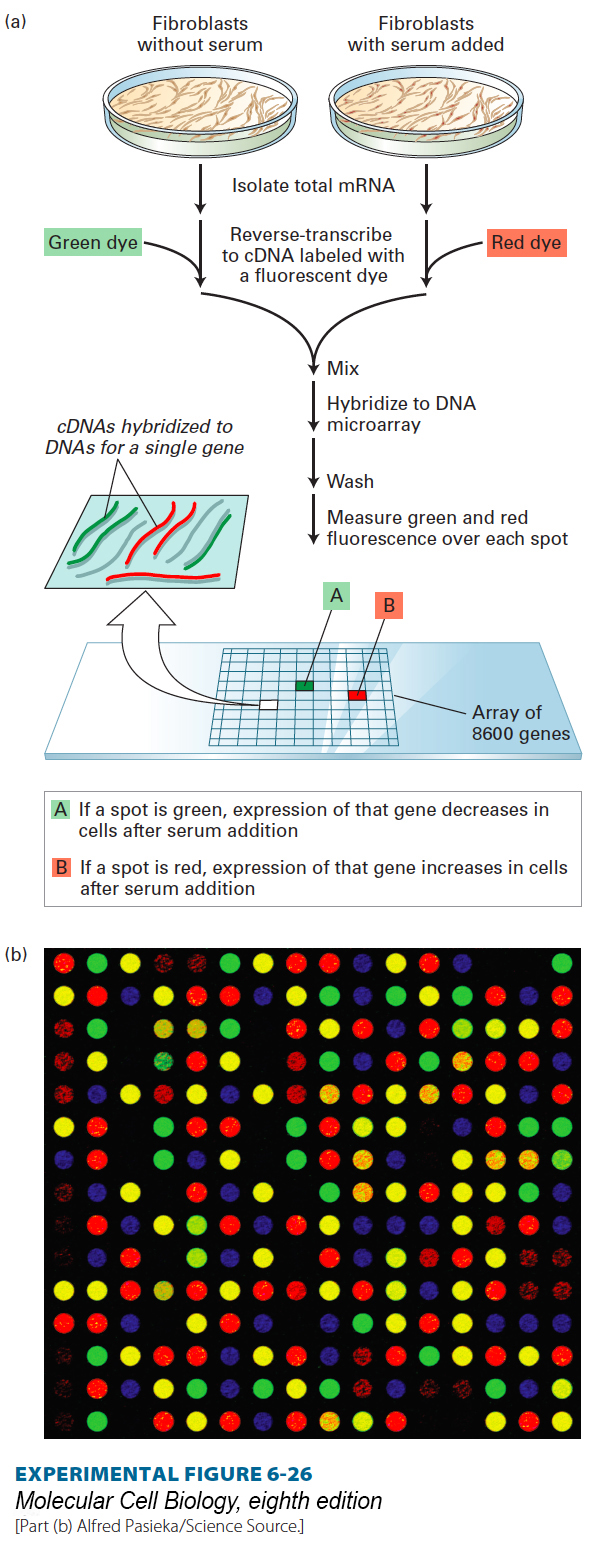
EXPERIMENTAL FIGURE 6-26 DNA microarray analysis can reveal differences in gene expression in fibroblasts under different experimental conditions. (a) In this example, cDNA prepared from mRNA isolated from fibroblasts either starved for serum or after serum addition is labeled with different fluorescent dyes. A microarray composed of DNA spots representing 8600 mammalian genes is exposed to an equal mixture of the two cDNA preparations under hybridization conditions. The ratio of the intensities of red and green fluorescence over each spot, detected with a scanning confocal laser microscope, indicates the relative expression of each gene in response to serum. (b) A micrograph of a small segment of an actual DNA microarray. Each spot in this 16 × 16 array contains DNA from a different gene hybridized to control and experimental cDNA samples labeled with red and green fluorescent dyes. (A yellow spot indicates equal hybridization of green and red fluorescence, indicating no change in gene expression.)
[Part (b) Alfred Pasieka/Science Source.]