DNase I Footprinting and EMSA Detect Protein-DNA Interactions
The various transcription-control elements found in eukaryotic DNA are binding sites for regulatory proteins called transcription factors. The simplest eukaryotic cells encode hundreds of transcription factors, and the human genome encodes at least 1400. The transcription of each gene in the genome is independently regulated by combinations of specific transcription factors that bind to its transcription-control regions. The number of possible combinations of this many transcription factors is astronomical, sufficient to generate unique controls for every gene encoded in the genome.
In yeast, Drosophila, and other genetically tractable eukaryotes, numerous genes encoding transcription activators and repressors have been identified by classical genetic analyses like those described in Chapter 6. However, in mammals and other vertebrates, which are less amenable to such genetic analysis, most transcription factors have been detected initially and subsequently purified by biochemical techniques. In this approach, a DNA regulatory element that has been identified by the kinds of mutational analyses described above is used to identify cognate proteins—those proteins that bind specifically to it. Two common techniques for detecting such cognate proteins are DNase I footprinting and the electrophoretic mobility shift assay.
DNase I footprinting takes advantage of the fact that when a protein is bound to a region of DNA, it protects that DNA sequence from digestion by nucleases. As illustrated in Figure 9-24a, samples of a DNA fragment that has been labeled with a radioactive atom at one end of one strand are digested under carefully controlled conditions in the presence and absence of a DNA-binding protein, then denatured and electrophoresed, and the resulting gel is subjected to autoradiography. The region protected by the bound protein appears as a gap, or “footprint,” in the array of bands resulting from digestion in the absence of the protein. When footprinting is performed with a DNA fragment containing a known transcription-control element, the appearance of a footprint indicates the presence of a transcription factor that binds that control element in the protein sample being assayed. Footprinting also identifies the specific DNA sequence to which the transcription factor binds.
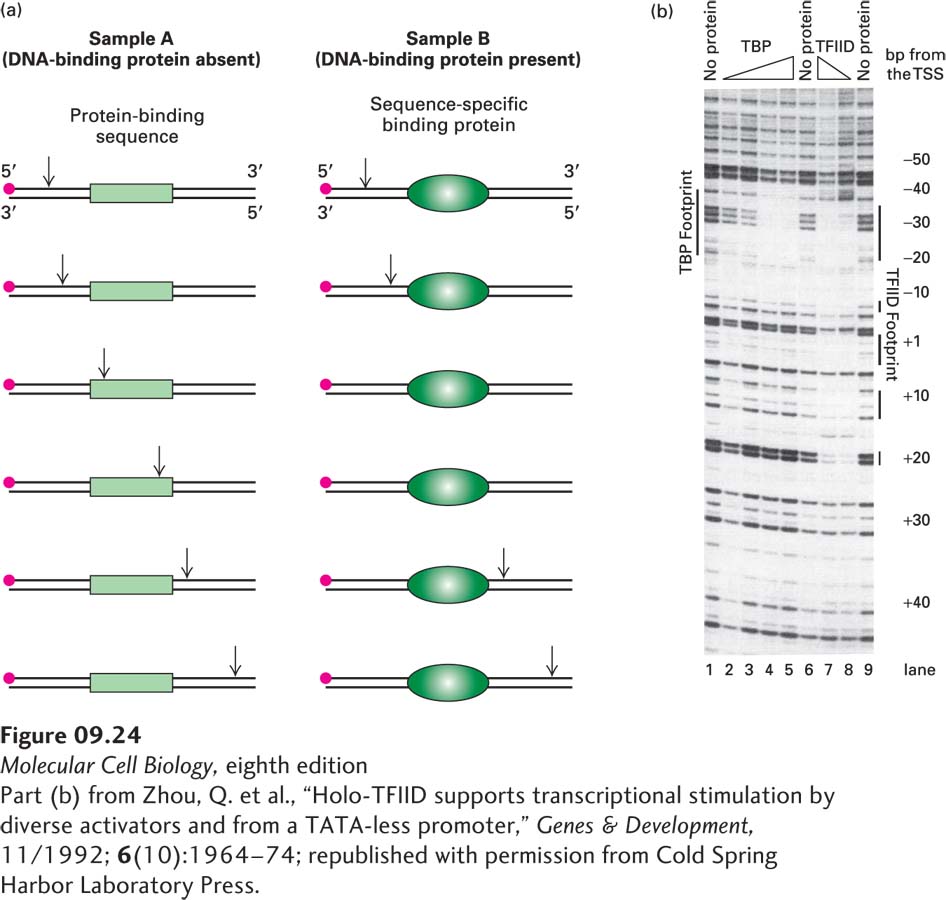
EXPERIMENTAL FIGURE 9-24 DNase I footprinting reveals the region of a DNA sequence where a transcription factor binds. (a) A DNA fragment known to contain a transcription-control element is labeled at one end with 32P (red dot). Portions of the labeled DNA sample are then digested with DNase I in the presence and in the absence of protein samples containing a sequence-specific DNA-binding protein. DNase I hydrolyzes the phosphodiester bonds of DNA between the 3′ oxygen on the deoxyribose of one nucleotide and the 5′ phosphate of the next nucleotide. A low concentration of DNase I is used so that, on average, each DNA molecule is cleaved just once (vertical arrows). If the protein sample does not contain a protein that binds to a specific sequence in the labeled DNA, the DNA fragment is cleaved at multiple positions between the labeled and unlabeled ends of the original fragment, as in sample A (left). If the protein sample does contain such a protein, as in sample B (right), the protein binds to its cognate sequence in the DNA, thereby protecting a portion of the fragment from digestion. Following DNase treatment, the DNA is separated from protein, denatured to separate the strands, and electrophoresed. Autoradiography of the resulting gel detects only labeled strands and reveals fragments extending from the labeled end to the site of cleavage by DNase I. Cleavage fragments containing the transcription-control element show up on the gel for sample A but are missing in sample B because the bound cognate protein has blocked cleavages within that sequence and thus production of the corresponding fragments. The missing bands on the gel constitute the footprint. (b) Footprints produced by increasing amounts of TBP (indicated by the triangle) and of TFIID on the strong adenovirus major late promoter.
[Part (b) from Zhou, Q. et al., “Holo-TFIID supports transcriptional stimulation by diverse activators and from a TATA-less promoter,” Genes & Development, 11/1992; 6(10):1964–74; republished with permission from Cold Spring Harbor Laboratory Press.]
For example, DNase I footprinting of the strong adenovirus late promoter shows a protected region over the TATA box when TBP is added to the labeled DNA before DNase I digestion (Figure 9-24b). DNase I does not digest all phosphodiester bonds in a duplex DNA at equal rate. Consequently, in the absence of added protein (lanes 1, 6, and 9), a particular pattern of bands is observed that depends on the DNA sequence and results from cleavage at some phosphodiester bonds and not others. However, when increasing amounts of TBP are incubated with the end-labeled DNA before digestion with DNase I, TBP binds to the TATA box, and when sufficient TBP is added to bind all the labeled DNA molecules, it protects the region between about −35 and −20 from digestion (lanes 2–5). In contrast, increasing amounts of TFIID (lanes 7 and 8) protect not only the TATA box region, but also regions near −7, +1 to +5, +10 to +15, and +20 from digestion, producing a different “footprint” from TBP. Results such as this tell us that other subunits of TFIID (the TBP-associated factors, or TAFs) also bind to the DNA in the region downstream from the TATA box.
The electrophoretic mobility shift assay (EMSA), also called the gel-shift or band-shift assay, is more useful than the footprinting assay for quantitative analysis of DNA-binding proteins. In general, the electrophoretic mobility of a DNA fragment is reduced when it is complexed with protein, causing a shift in the location of the fragment band. EMSA can be used to detect a transcription factor in protein fractions incubated with a radiolabeled DNA fragment (the probe) containing a known control element (Figure 9-25). The more transcription factor is added to the binding reaction, the more labeled probe is shifted to the position of the DNA-protein complex.
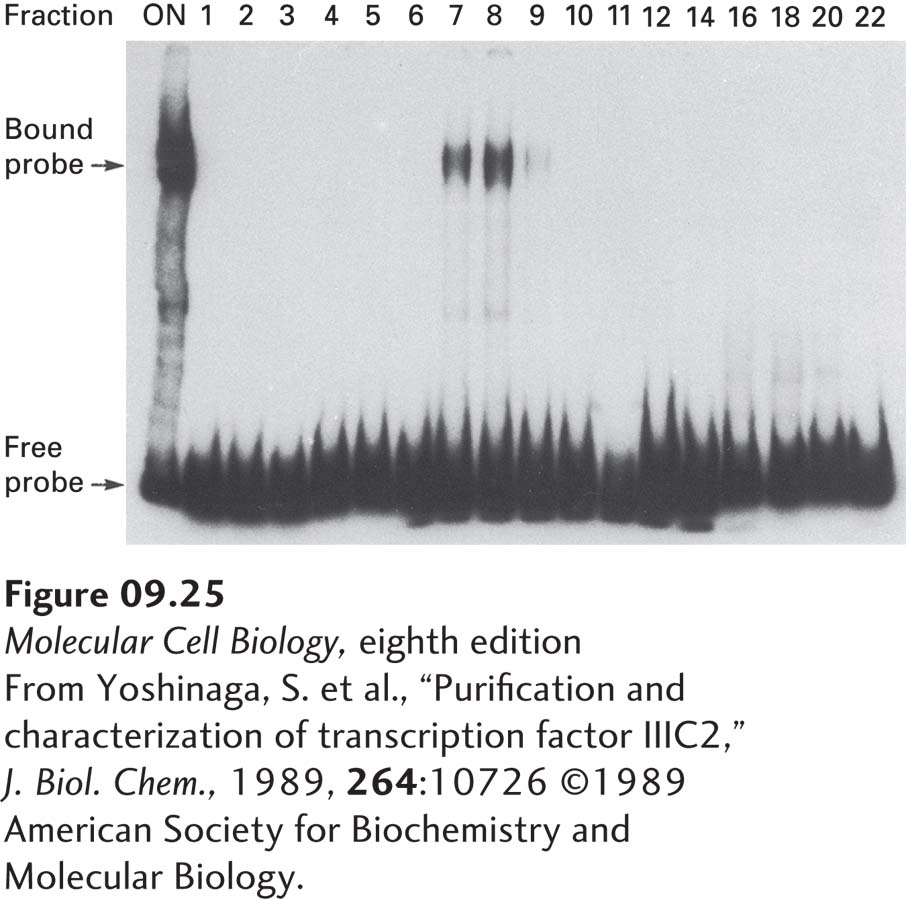
EXPERIMENTAL FIGURE 9-25 The electrophoretic mobility shift assay can be used to detect transcription factors during purification. In this example, protein fractions separated by column chromatography were assayed for their ability to bind to a radiolabeled DNA-fragment probe containing a known regulatory element. After an aliquot of the protein sample was loaded onto the column (ON) and successive column fractions (numbers) were incubated with the labeled probe, the samples were electrophoresed under conditions that do not disrupt protein-DNA interactions. The free probe not bound to protein migrated to the bottom of the gel. A protein in the preparation applied to the column and in fractions 7 and 8 bound to the probe, forming a DNA-protein complex that migrated more slowly than the free probe. These fractions are therefore likely to contain the regulatory protein being sought.
[From Yoshinaga, S. et al., “Purification and characterization of transcription factor IIIC2,” J. Biol. Chem., 1989, 264:10726 ©1989 American Society for Biochemistry and Molecular Biology.]
In the biochemical isolation of a transcription factor, an extract of cell nuclei is commonly subjected sequentially to several types of liquid chromatography (see Chapter 3). Fractions eluted from the columns are assayed by DNase I footprinting or EMSA using DNA fragments containing an identified regulatory element (see Figure 9-22). Fractions containing a protein that binds to the regulatory element in these assays contain a putative transcription factor. A powerful technique that is commonly used for the final step in purifying transcription factors is sequence-specific DNA affinity chromatography, a particular type of affinity chromatography in which long DNA strands containing multiple copies of the transcription-factor-binding site are coupled to a column matrix.
Once a transcription factor has been isolated and purified, its partial amino acid sequence can be determined and used to clone the gene or cDNA encoding it, as outlined in Chapter 6. The isolated gene can then be used to test the ability of the encoded protein to activate or repress transcription in an in vivo transfection assay (Figure 9-26).
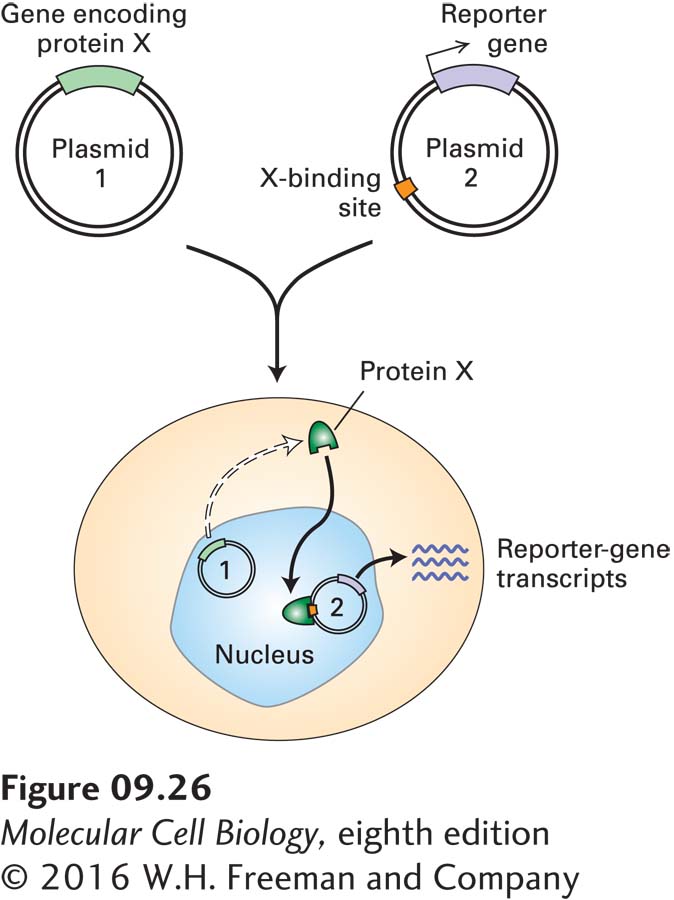
EXPERIMENTAL FIGURE 9-26 An in vivo transfection assay measures transcription activity to evaluate proteins believed to be transcription factors. The assay system requires two plasmids. One plasmid contains the gene encoding the putative transcription factor (protein X). The second plasmid contains a reporter gene (e.g., luciferase) and one or more binding sites for protein X. Both plasmids are simultaneously introduced into cells that lack the gene encoding protein X. The production of reporter-gene RNA transcripts is measured; alternatively, the activity of the encoded protein can be assayed. If reporter-gene transcription is greater in the presence of the X-encoding plasmid than in its absence, then the protein is an activator; if transcription is less, then it is a repressor. By use of plasmids encoding a mutated or rearranged transcription factor, important domains of the protein can be identified.