DNase I Hypersensitive Sites Reflect the Developmental History of Cellular Differentiation
In Chapter 8, we learned that an expressed gene is far more sensitive to digestion by DNase I (a bovine pancreatic enzyme) than the same gene in a different cell type in which it is not expressed (see Figure 8-34). In addition to this general increase in DNase I sensitivity over long regions, researchers later found that specific short regions of the genome, on the order of a hundred base pairs in length, are extremely sensitive to DNase I digestion and are the first regions cut when isolated nuclei are treated with low levels of DNase I. These sites are known as DNase I hypersensitive sites (DHSs). High-throughput sequencing methods have allowed mapping of DHSs across the genome in multiple differentiated and embryonic cell types. Briefly, after digestion of isolated nuclei with low levels of DNase I, DNA is isolated from the treated chromatin. Oligonucleotide linkers of a known sequence are ligated to the DNA ends generated by DNase I digestion. Then the DNA is sheared into small fragments by sonication, amplified by PCR, and sequenced. Human DNA sequences adjacent to the known sequence of the oligonucleotide linker were thus identified as DHSs.
Figure 9-41a shows plots of the number of times a DHS was sequenced—a measure of the DNase sensitivity of the site—in samples from the human cell types indicated at the left. A roughly 600-kb region of the genome on chromosome 12, located 96.2–96.8 Mb from the left end of the chromosome, is shown. The height of each vertical bar represents the degree of sensitivity of the DNA sequence at that position to digestion in nuclei isolated from each of the cell types.
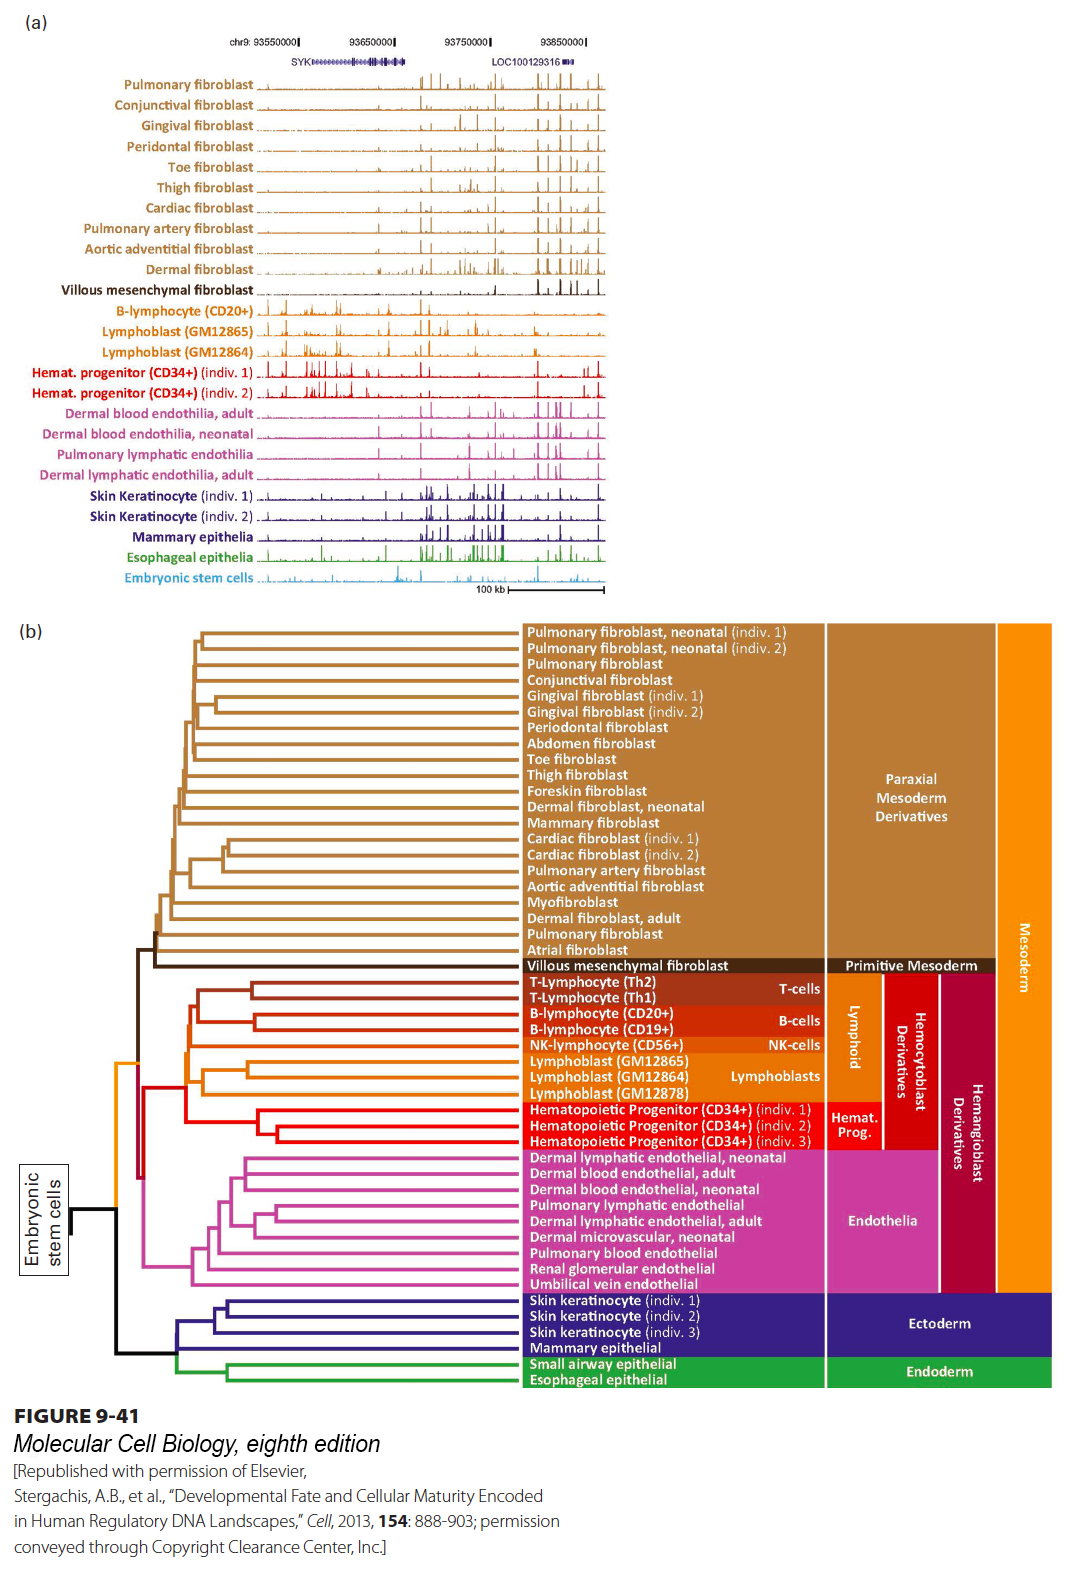
FIGURE 9-41 Maps of DNase I hypersensitive sites in embryonic and adult cells reflect their developmental history. (a) DHSs from each of the human cell types shown at the left are mapped in the interval on chromosome 12 between 96.2 and 96.8 Mb from the left end. The height of each vertical bar in the figure represents the number of times a sequence in a 50-bp interval at that position was sequenced after following the protocol described in the text to ligate a linker of known sequence to DNA ends resulting from low-level DNase I digestion of chromatin. The plots are color-coded according to the embryonic tissue from which they developed, as shown in (b). (b) Dendrogram showing the relationships among the DHS maps for each cell type across the entire genome. The embryonic tissue from which each of these cell types develops is shown at the right. Embryonic stem cells form the root of the dendrogram. The DHS maps for all other cell types are derived from those for the embryonic stem cell by loss of some DHSs and the acquisition of other DHSs. The dendrogram, based on how closely DHS maps from two cell types are related, parallels the developmental relationships among the cell types.
[Republished with permission of Elsevier, Stergachis, A.B., et al., “Developmental Fate and Cellular Maturity Encoded in Human Regulatory DNA Landscapes,” Cell, 2013, 154: 888-903; permission conveyed through Copyright Clearance Center, Inc.]
Mapping of binding sites for specific transcription factors by chromatin immunoprecipitation (see Figure 9-18) has shown that most transcription-factor-binding sites are coincident with DHSs. This may be because the DNA-binding domain of the bound transcription factor exposes DNA flanking the binding site to DNase I digestion, or because the transcription-factor activation domain interacts with chromatin-remodeling complexes that destabilize the interaction of DNA with histone octamers in neighboring nucleosomes, causing the DNA to be more sensitive to DNase I digestion. Because DHSs are coincident with bound transcription factors, the DHS pattern in a region of chromatin represents the positions of bound transcription factors, although the transcription factors bound are not directly identified.
In Figure 9-41a, the type of tissue from which the DHS data were determined is shown on the left, and the embryonic tissues from which these tissue types developed are color-coded as indicated in Figure 9-41b. It is apparent that more closely related cell types, such as fibroblasts from different regions of the body, or endothelial cells that line the inner surfaces of blood vessels from different organs, have more similar DHSs than more distantly related cell types. With computer methods, it is possible to compare the similarity of the DHS maps for each of these cell types across the entire genome. With these computational methods, a dendrogram can be generated showing how closely the DHS map from one cell type resembles those of other cell types (see Figure 9-41b). This dendrogram is similar to the dendrograms used to show the relatedness, and hence the evolution, of gene sequences (see Figure 8-21b).
Importantly, the DHS pattern of embryonic stem cells is at the root of the DHS dendrogram for all cell types (see Figure 9-41b). These cells from the inner cell mass of the early mammalian embryo, discussed in Chapter 21 (see Figure 21-5), are the progenitors of all cells in the adult organism. Embryonic stem cells appear to have the most complex transcriptional control of all cells in that they have the largest number of DHSs: about 257,000 in one study, compared with 90,000–150,000 in differentiated cells. This difference probably reflects the developmental potential of embryonic stem cells. Approximately 30 percent of the DHSs observed in adult differentiated cells are also observed in embryonic stem cells, but a different 30 percent is retained in each adult cell type. An additional 50,000–100,000 new DHSs not found in embryonic stem cells arise during development, but a different set of DHSs arises in each cell type. These DHS patterns reveal the complexity of the combinations of transcription factors that regulate each gene. Approximately a million distinct DHSs were characterized in the cell types shown in Figure 9-41, suggesting that on average, combinations of four or five enhancers regulate the transcription of each of the roughly 21,000 genes in the human genome. This analysis excluded the central nervous system, probably the most complex organ system of all, so the total number of human enhancers may be much larger. But in the tissues analyzed, the maps of DHSs reveal where binding of early embryonic transcription factors is lost and where new cell-type-specific combinations of transcription factors bind as a cell differentiates from the embryonic stem cell. Even this estimate fails to capture the complexity of transcriptional control, since many transcription-factor-binding sites detected as one DHS are bound by different related transcription factors expressed in different cell types. Often different related transcription factors bind to the same transcription-control region in different cell types to regulate the appropriate level of transcription for that cell type.