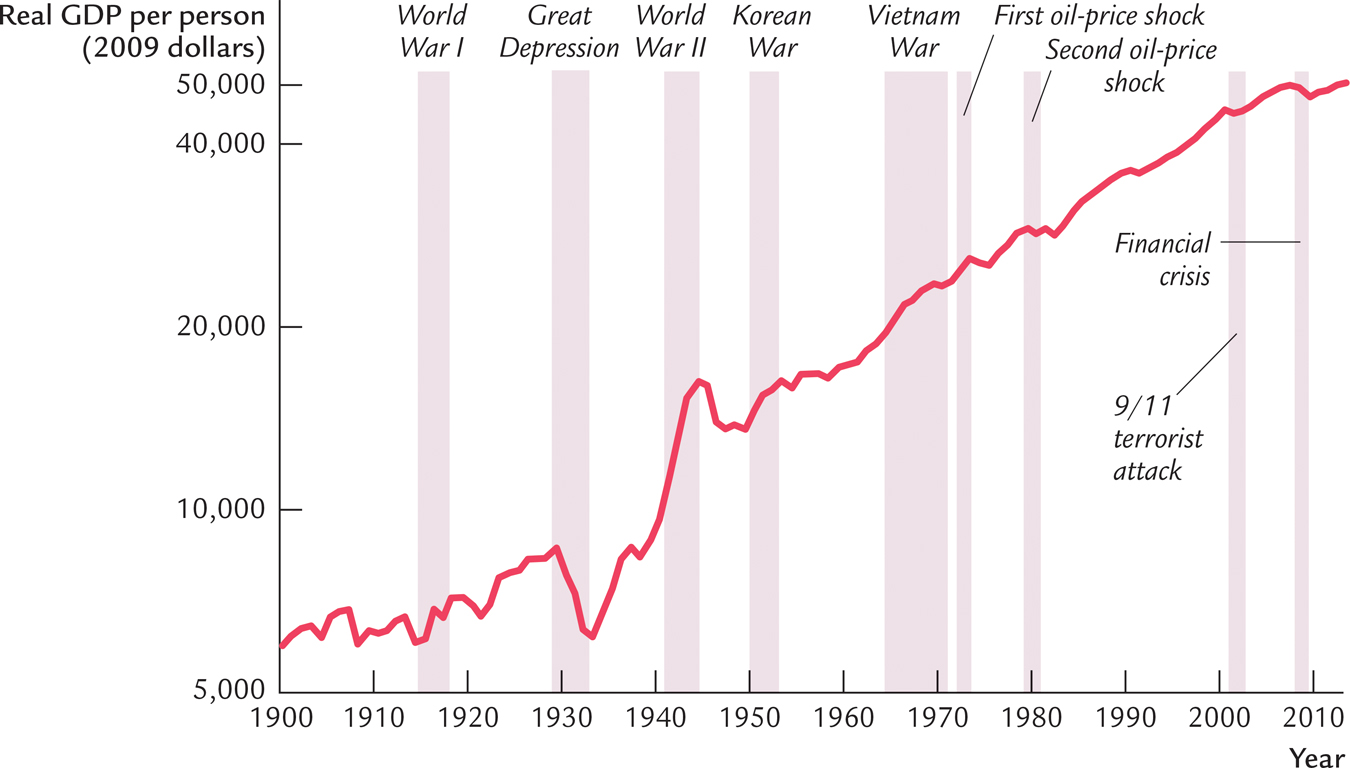
FIGURE 1-
Note: Real GDP is plotted here on a logarithmic scale. On such a scale, equal distances on the vertical axis represent equal percentage changes. Thus, the distance between $5,000 and $10,000 (a 100 percent change) is the same as the distance between $10,000 and $20,000 (a 100 percent change).
Data from: U.S. Department of Commerce, Economic History Association.
Data from: U.S. Department of Commerce, Economic History Association.