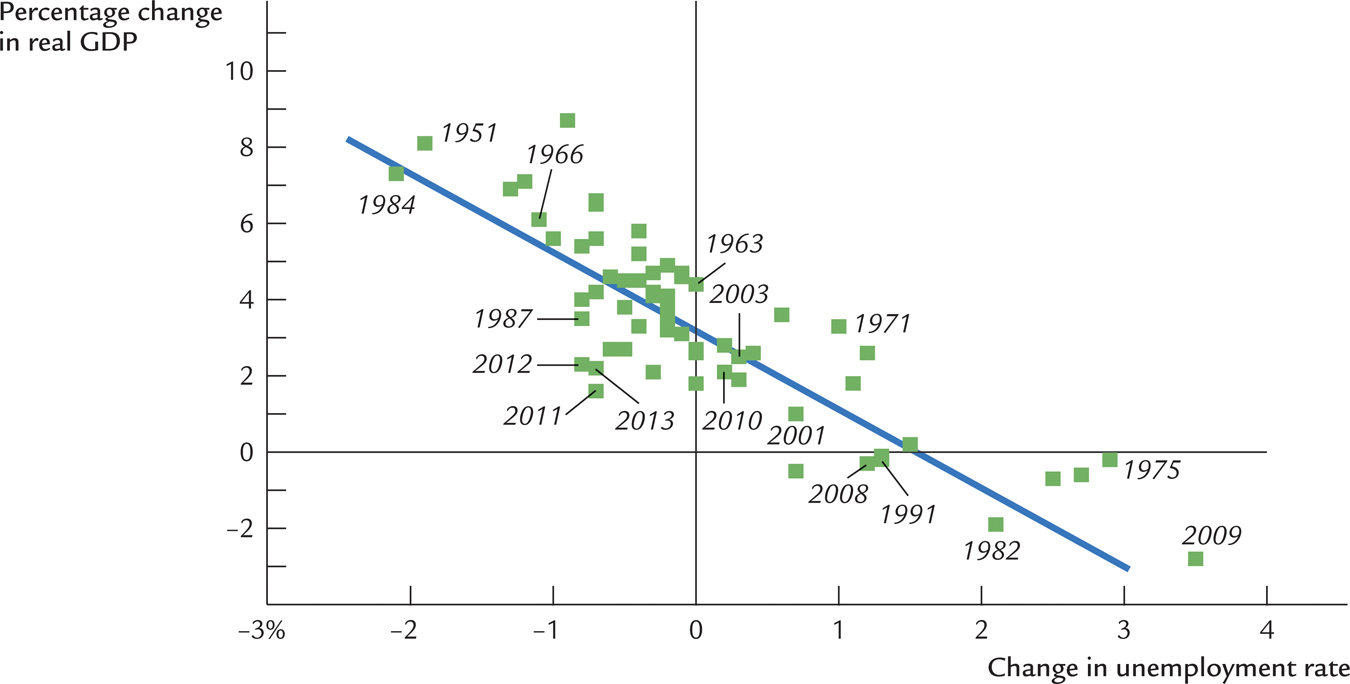
FIGURE 10-4: Okun’s Law This figure is a scatterplot of the change in the unemployment rate on the horizontal axis and the percentage change in real GDP on the vertical axis, using data on the U.S economy. Each point represents one year. The figure shows that increases in unemployment tend to be associated with lower-than-normal growth in real GDP. The correlation between these two variables is −0.84.
Data from: U.S. Department of Commerce, U.S. Department of Labor.