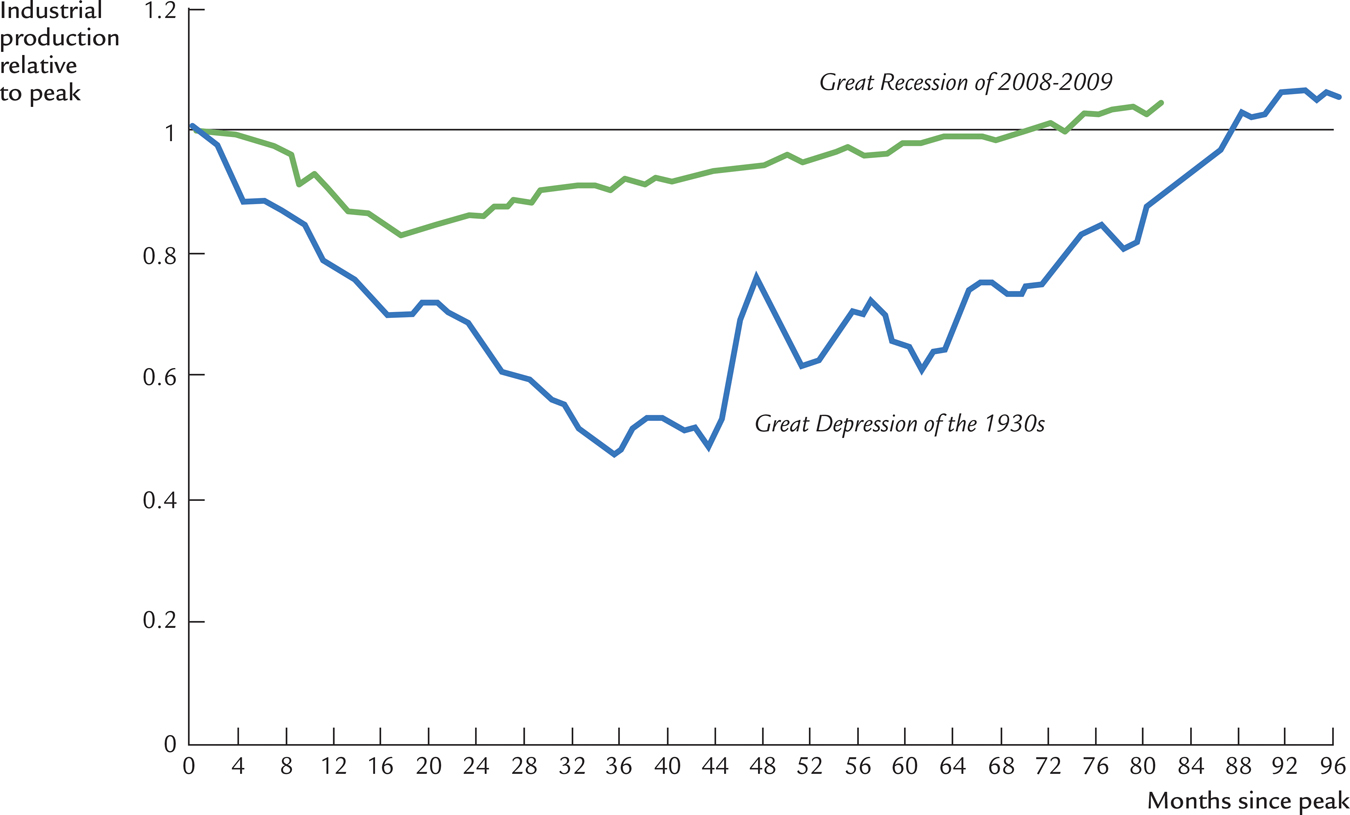
FIGURE 12-9: The Great Recession and the Great Depression This figure compares industrial production during the Great Recession of 2008–2009 and during the Great Depression of the 1930s. Output is normalized to be 100 for the peak before the downturn (December 2007 and August 1929). The data show that the recent downturn was much shallower and shorter.
Data from: Board of Governors of the Federal Reserve System.