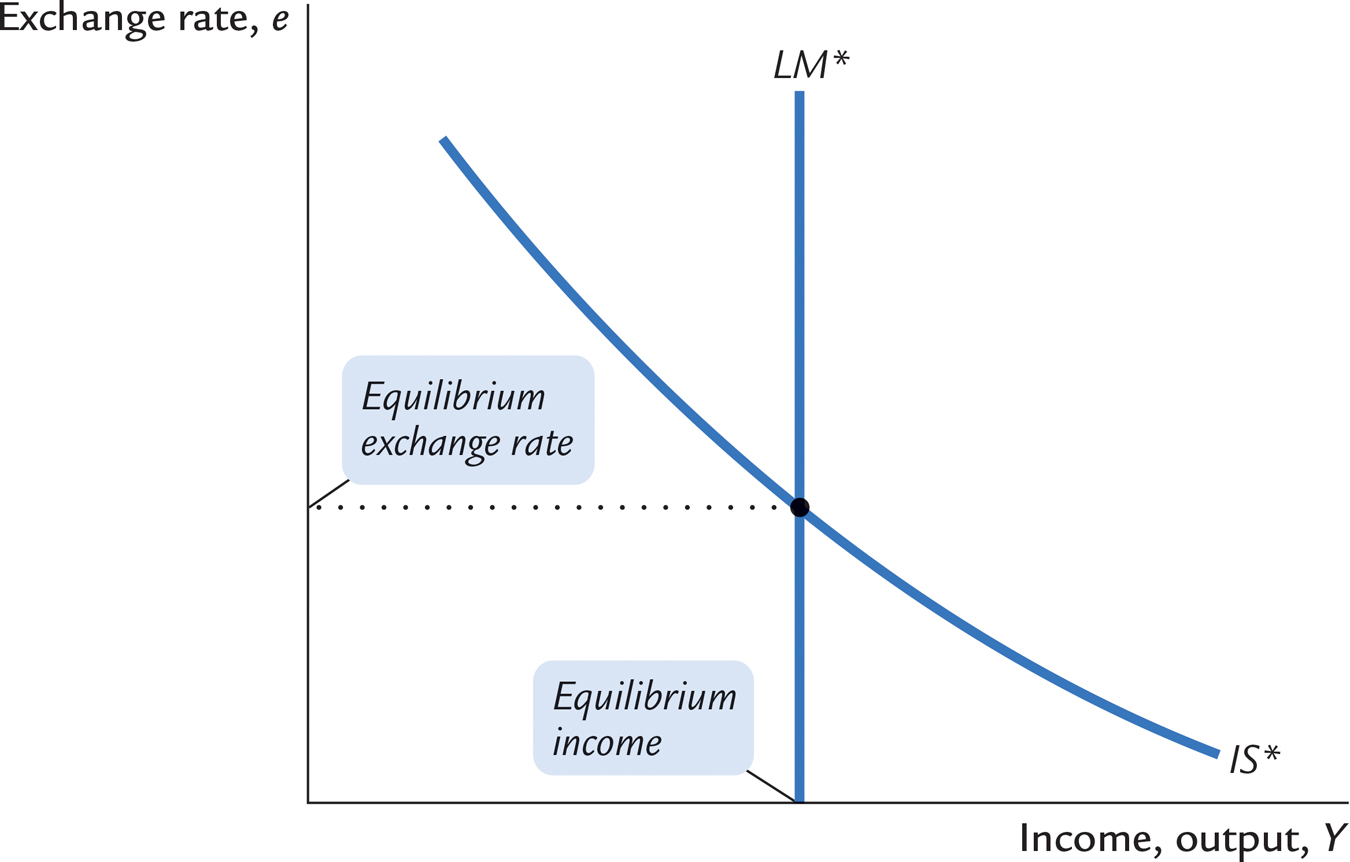
FIGURE 13-3: The Mundell–Fleming Model This graph of the Mundell–Fleming model plots the goods market equilibrium condition IS* and the money market equilibrium condition LM*. Both curves are drawn holding the interest rate constant at the world interest rate. The intersection of these two curves shows the level of income and the exchange rate that satisfy equilibrium both in the goods market and in the money market.