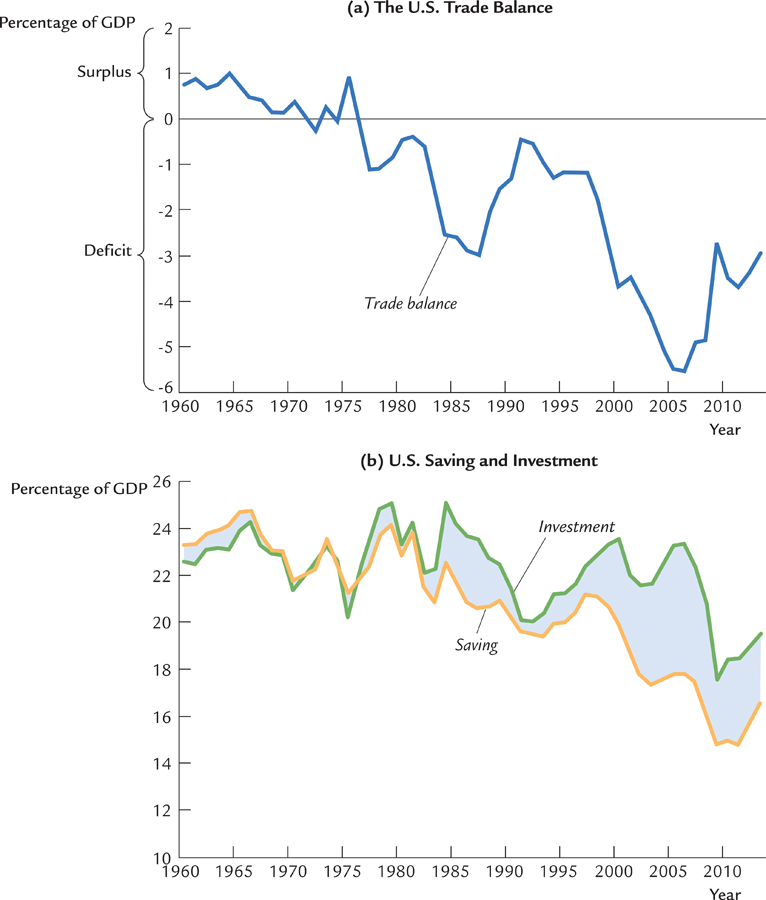
FIGURE 6-6: The Trade Balance, Saving, and Investment: The U.S. Experience Panel (a) shows the trade balance as a percentage of GDP. Positive numbers represent a surplus, and negative numbers represent a deficit. Panel (b) shows national saving and investment as a percentage of GDP from 1960 to 2013. The trade balance equals saving minus investment.
Data from: U.S. Department of Commerce.