PROBLEMS AND APPLICATIONS
For any problem marked with  , there is a Work It Out online tutorial available for a similar problem. To access these interactive, step-
Question 11.5
1. Use the Keynesian cross model to predict the impact on equilibrium GDP of the following. In each case, state the direction of the change and give a formula for the size of the impact.
An increase in government purchases
An increase in taxes
Equal-
sized increases in both government purchases and taxes
Question 11.6
2.  • In the Keynesian cross model, assume that the consumption function is given by
C = 120 + 0.8 (Y − T).
Planned investment is 200; government purchases and taxes are both 400.
Graph planned expenditure as a function of income.
What is the equilibrium level of income?
If government purchases increase to 420, what is the new equilibrium income? What is the multiplier for government purchases?
What level of government purchases is needed to achieve an income of 2,400? (Taxes remain at 400.)
What level of taxes is needed to achieve an income of 2,400? (Government purchases remain at 400.)
Question 11.7
3. Although our development of the Keynesian cross in this chapter assumes that taxes are a fixed amount, most countries levy some taxes that rise automatically with national income. (Examples in the United States include the income tax and the payroll tax.) Let’s represent the tax system by writing tax revenue as

where T and t are parameters of the tax code. The parameter t is the marginal tax rate: if income rises by $1, taxes rise by t × $1.
How does this tax system change the way consumption responds to changes in GDP?
336
In the Keynesian cross, how does this tax system alter the government-
purchases multiplier? In the IS–LM model, how does this tax system alter the slope of the IS curve?
Question 11.8
4. Consider the impact of an increase in thriftiness in the Keynesian cross model. Suppose the consumption function is

where C is a parameter called autonomous consumption that represents exogenous influences on consumption and c is the marginal propensity to consume.
What happens to equilibrium income when the society becomes more thrifty, as represented by a decline in
 ?
?What happens to equilibrium saving?
Why do you suppose this result is called the paradox of thrift?
Does this paradox arise in the classical model of Chapter 3? Why or why not?
Question 11.9
5.  • Suppose that the money demand function is
(M/P)d = 800 − 50r,
where r is the interest rate in percent. The money supply M is 2,000 and the price level P is fixed at 5.
Graph the supply and demand for real money balances.
What is the equilibrium interest rate?
What happens to the equilibrium interest rate if the supply of money is reduced from 2,000 to 1,500?
If the central bank wants the interest rate to be 4 percent, what money supply should it set?
Question 11.10
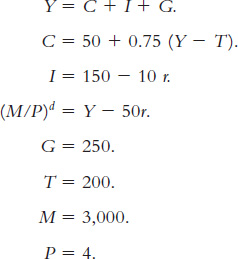
6.  • The following equations describe an economy.

Identify each of the variables and briefly explain their meaning.
From the above list, use the relevant set of equations to derive the IS curve. Graph the IS curve on an appropriately labeled graph.
From the above list, use the relevant set of equations to derive the LM curve. Graph the LM curve on the same graph you used in part (b).
What are the equilibrium level of income and the equilibrium interest rate?