FIGURE 1-6
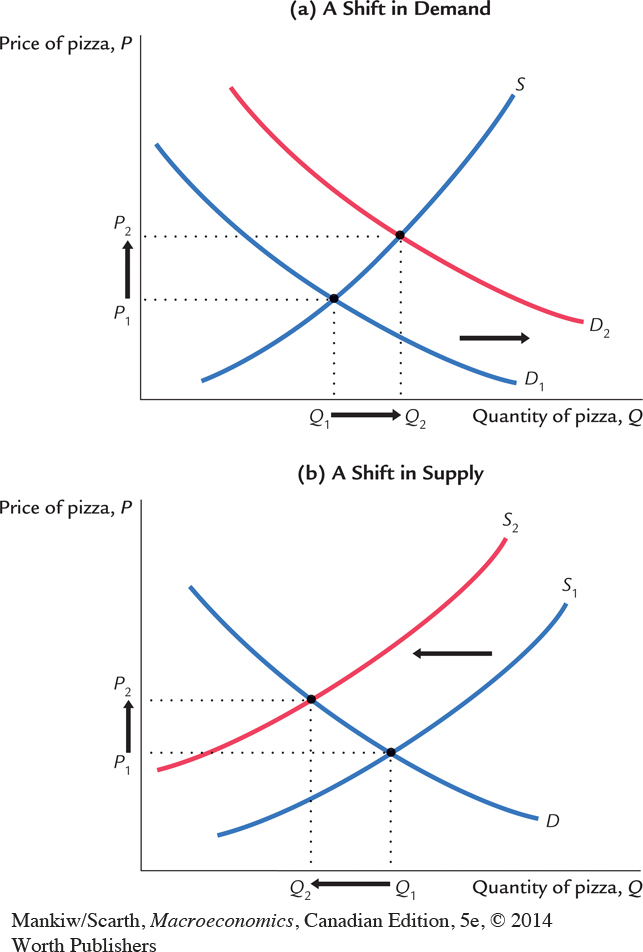 Changes in Equilibrium In panel (a), a rise in aggregate income causes the demand for pizza to increase: at any given price, consumers now want to buy more pizza. This is represented by a rightward shift in the demand curve from D1 to D2. The market moves to the new intersection of supply and demand. The equilibrium price rises from P1 to P2, and the equilibrium quantity of pizza rises from Q1 to Q2. In panel (b), a rise in the price of materials decreases the supply of pizza: at any given price, pizzerias find that the sale of pizza is less profitable and therefore choose to produce less pizza. This is represented by a leftward shift in the supply curve from S1 to S2. The market moves to the new intersection of supply and demand. The equilibrium price rises from P1 to P2, and the equilibrium quantity falls from Q1 to Q2.