FIGURE 2-1
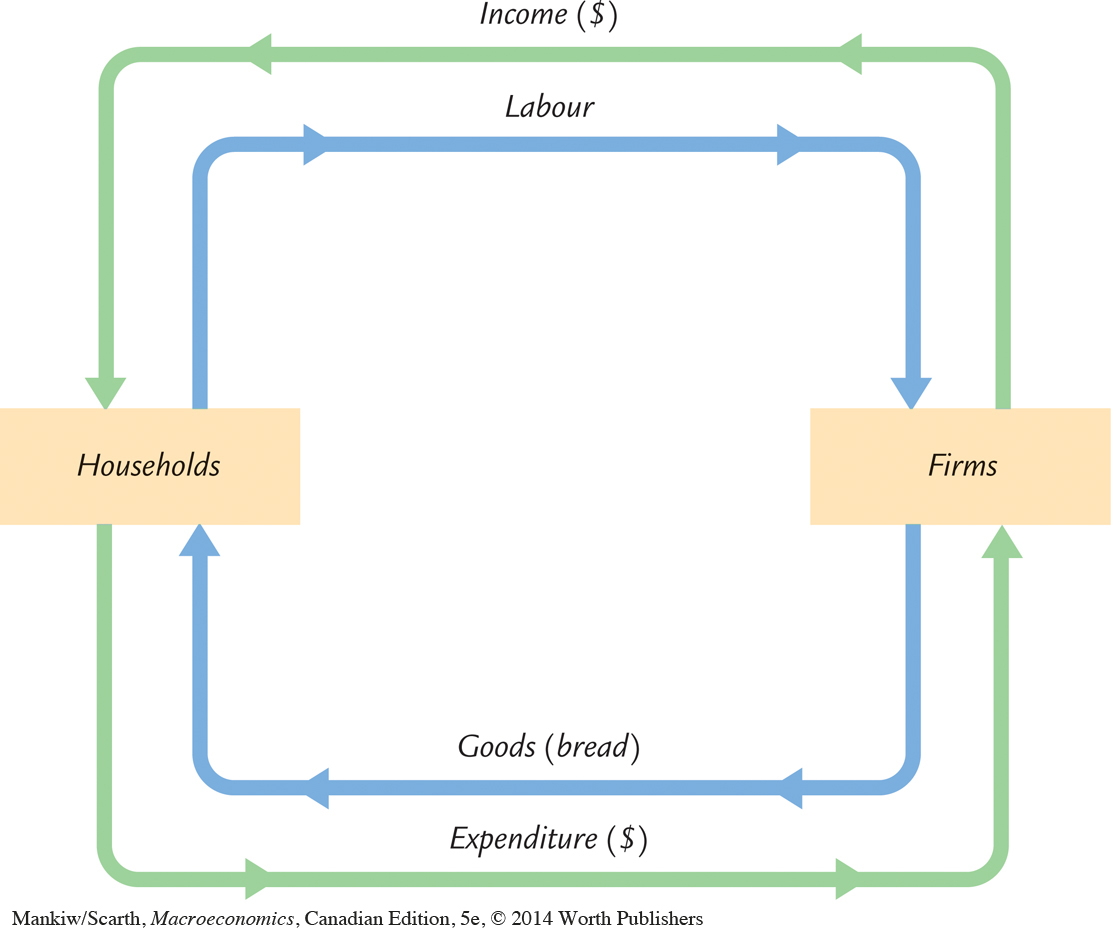 The Circular Flow This figure illustrates the flows between firms and households in an economy that produces one good, bread, from one input, labour. The inner loop represents the flows of labour and bread: households sell their labour to firms, and the firms sell the bread they produce to households. The outer loop represents the corresponding flows of dollars: households pay the firms for the bread, and the firms pay wages and profit to the households. In this economy, GDP is both the total expenditure on bread and the total income from the production of bread.