FIGURE 2-3
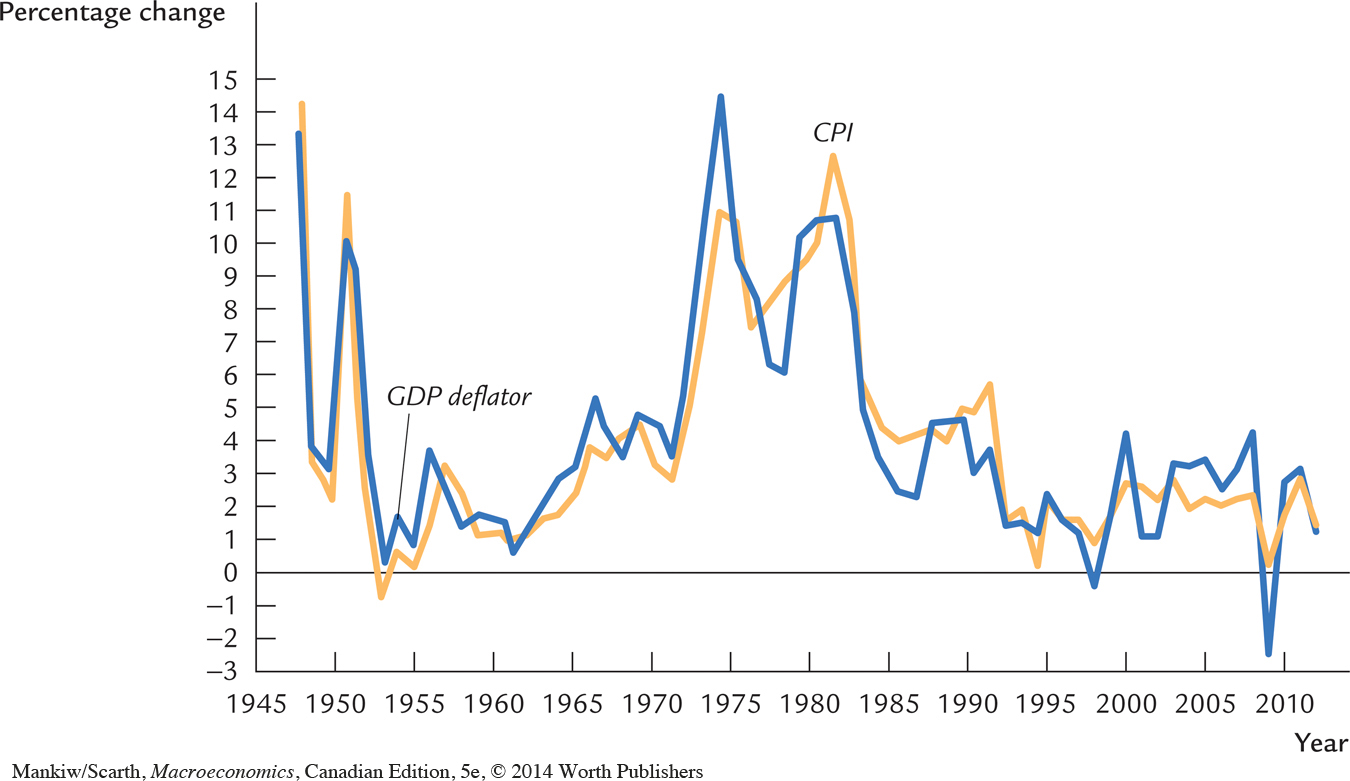 The Inflation Rate as Measured by the GDP Deflator and the CPI This figure shows the percentage change in the GDP deflator and in the CPI for every year since 1948. Although these two measures of prices diverge at times, they usually tell the same story about how quickly prices are rising. Both the CPI and the GDP deflator show that prices rose slowly in most of the 1950s and 1960s, that they rose much more quickly in the 1970s, and that they rose slowly again after the 1980s.
 Source: Statistics Canada, CANSIM series 1997756 and 737344.