FIGURE 2-5
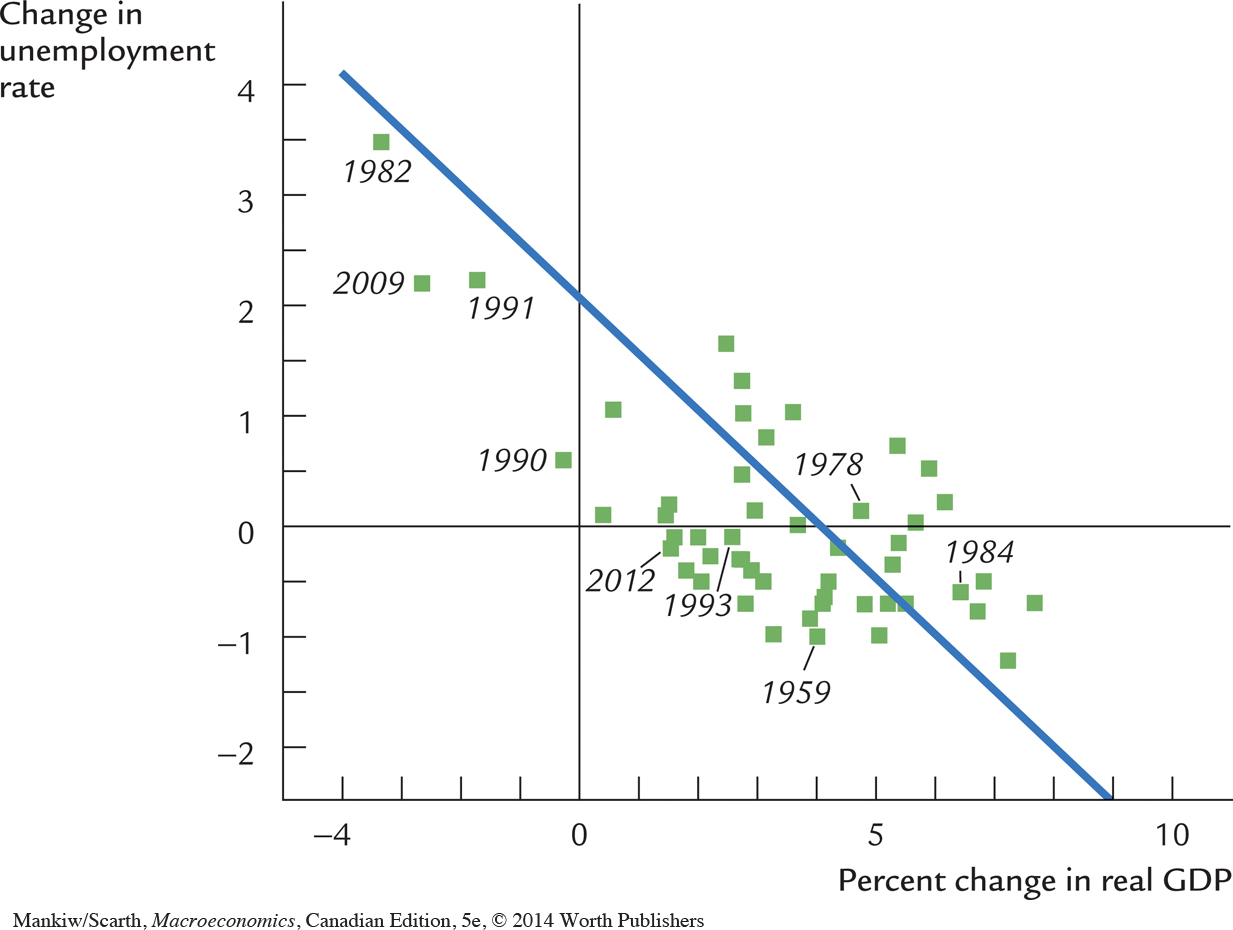 Okun’s Law This figure is a scatterplot of the change in the unemployment rate on the vertical axis and the percentage change in real GDP on the horizontal axis for the last 50 years. Each point represents one year. The negative correlation between these variables shows that increases in unemployment tend to be associated with decreases in real GDP.
Source: Statistics Canada, CANSIM series 1992067 and 2461224.