FIGURE 3-1
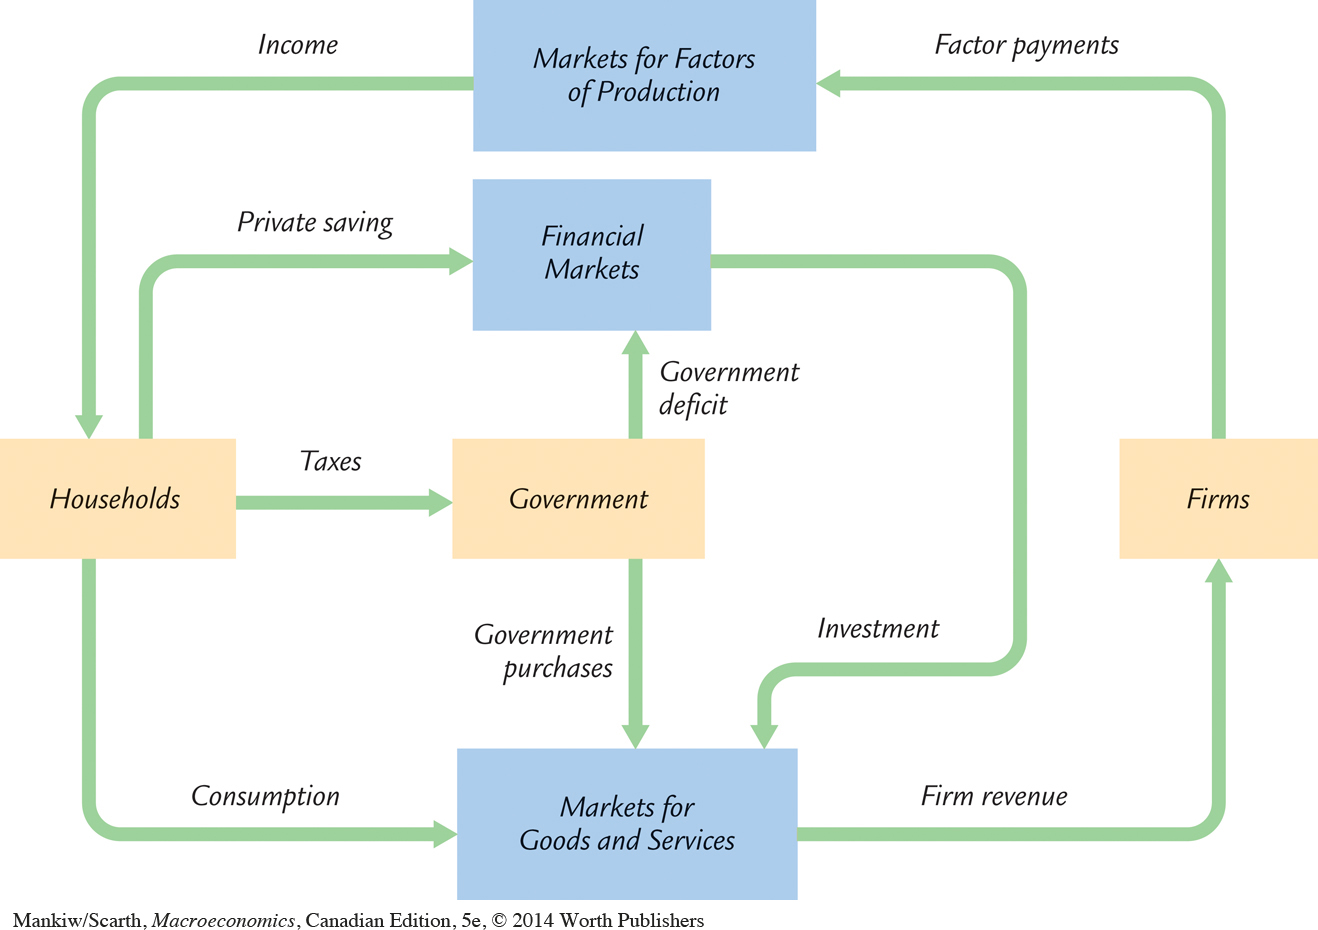 The Circular Flow of Dollars Through the Economy This figure is a more realistic version of the circular flow diagram found in Chapter 2. Each beige box represents an economic actor—households, firms, and the government. Each blue box represents a type of market—the markets for goods and services, the markets for the factors of production, and financial markets. The green arrows show the flow of dollars among the economic actors through the three types of markets.