FIGURE 3-14
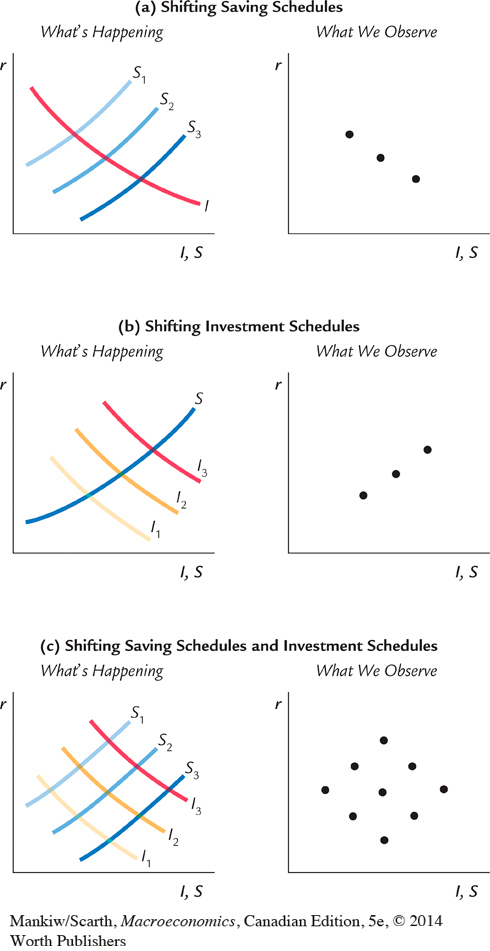 Identifying the Investment Function When we look at data on interest rates r and investment l, what we find depends on which exogenous variables are changing. In panel (a), the saving schedule is shifting, perhaps because of changes in fiscal policy; we would observe a negative correlation between r and l. In panel (b), the investment schedule is shifting, perhaps because of technological innovations; we would observe a positive correlation between r and l. In the more realistic situation shown in panel (c), both schedules are shifting. In the data, we would observe no correlation between r and l, which is in fact what reseachers typically find.